MasterSearch

Showing posts with label Debt. Show all posts

Wednesday, January 23, 2013

#China Narrowly Averts #Credit Bubble Pop With Latest Government Bailout Of First Domestic #Bond #Default | Zero Hedge


See the whole article here:  China Narrowly Averts Credit Bubble Pop With Latest Government Bailout Of First Domestic Bond Default | Zero Hedge


Friday, November 11, 2011

FT Alphaville » French exposure in pictures

Interconnectedness of the EuroZone Financial System, from the Banca d'Italia's latest financial Stability Report of Nov. 2, via the FT's Alphaville

French exposure in pictures

Au bout du fossé, la culbute.

Brace yourself. Here are some reasons why markets are giving France, in particular, a kicking today, according to the Banca D’Italia’s latest financial sector report on November 2:

(Click to enlarge)

Source: Banca d’Italia

We will reserve judgement for now and let you mull this over. In the bank’s words: (Emphasis ours)

Figure A shows the trend in the total gross assets held by some large European Union countries (France, Germany, Italy, the Netherlands and the United Kingdom) vis-à-vis Greece, Ireland and Portugal in the aggregate and also Belgium, Italy and Spain.

The growth of gross assets was rapid for France, which had total exposure equal to about 60 per cent of its GDP at the end of 2009. For Germany the rise was more moderate but still resulted in an overall exposure of more than 30 per cent of GD P. The United Kingdom’s exposure to Greece, Ireland and Portugal rose particularly sharply (to over 25 per cent of GDP).

For the Netherlands, whose degree of openness and financial deepening is especially high, the exposure to the six countries comes to more than 100 per cent of GDP, owing in part to the massive presence of special purpose entities controlled by European financial companies. Italy’s overall exposure to the countries with sovereign debt strains – not counting domestic assets – is much lower (less than 15 per cent of GD P), compared with the other main European countries.

For both France and Germany the largest component of the exposure is debt securities (government and corporate), followed by bank loans (Figure B). For the UK the exposure consists primarily of substantial bank assets vis-à-vis Ireland.

And like manna from — eurozone-financial-exposure-statistics — heaven, the Institute for International Finance’s (IIF) Capital Markets Monitor, published Wednesday, dishes out more reasons to be bearish, particularly viz a viz France. (Click here to enlarge:)

Here come the bank deleveraging waves, current account adjustments, spike in contingent liabilities on sovereign balance sheets, safe haven bids etc… you know the drill by now.


FT Alphaville » French exposure in pictures

Share this|
________________________ The MasterBlog

Wednesday, November 02, 2011

Who's Buying U.S. Debt?: 1955-Today - MarketBeat - WSJ

As diehard Treasury bond geeks, you gotta love the charts that accompany Treasury Borrowing Advisory Committee’s quarterly refunding report.

As we contemplate the massive amount of debt that the U.S. has managed to pile up over the years, it’s worth taking a look at who’s been loaning us the cash. This chart goes a long way to answer that question, showing the major holders of Treasury debt over time. You have to note that rather sharp uptick in Fed holdings of Treasurys lately. (The red line.) But obviously the big story has been among foreign holders, whose lending to Uncle Sam has exploded over the last 20 years.

Treasury Department

The key question of course is why did foreign lending to the U.S. pick up so much in the mid-19990s. Well, some people would argue that this chart has a lot to do with it.

FactSet

This FactSet chart shows the exchange rate between the U.S. dollar and the Chinese Renminbi. It’s a little counter intuitive, but when the line goes up, the CNY is getting cheaper against the greenback. So you can that in early 1994, there was a large and sharp devaluation of the Chinese currency against the dollar, making Chinese goods way more competitive as exports. China devalued its currency, the yuan, to 8.7 yuan to the dollar from 5.8 yuan to the dollar on Jan. 1, 1994. More recently the Chinese government has let its currency appreciate against the dollar somewhat. But the U.S. wants a lot more.

By the way, another way of looking at this whole debt issue is basically as the flip side of the U.S. trade deficit. The trade deficit started getting bad in the 1980s. But it really really got terrible in the 1990s and worsened up until the financial crisis. Here’s a look at the current account deficits, which measures mostly trade in goods and services and also includes transfer payments and investment income, as a share of GDP.

FactSet

Basically, this means we started selling a lot less than we produce. That means our trading partners were socking away massive amounts of dollars that we paid them. And largely they stuck those dollars back into U.S. Treasurys for safekeeping. That keeps the U.S. borrowing costs low, which makes it easy for us to rely on too much debt. At that keeps the whole corrosive cycle going.


Who's Buying U.S. Debt?: 1955-Today - MarketBeat - WSJ

Wednesday, October 26, 2011

Chart of the Day: MF Global gets hit; Yield jumps to 18%

Chart of the Day

MF Global gets hit; Yield jumps to 18% on Moody's downgrade...

read the article below from zerohedge.com:

Will Goldman Be MF Global's Executioner With Terminal Collateral Calls, As Yields Explode?

Tyler Durden's picture [1]


We all know the news by now [12]: "MF reported its biggest quarterly loss ever yesterday, after having its credit ratings cut a day earlier by Moody’s Investors Service on concern that the broker won’t meet earnings targets and may not be able to manage investments in European sovereign debt. The company’s shares fell 48 percent. “It’s aggregated risk,” said Richard Repetto, an analyst at Sandler O’Neill & Partners LP. The positions in Europe, the further downgrade potential and the quarterly loss, combined to discourage investors, he said." Here is where it gets worse: "Analysts at KBW Inc., led by Niamh Alexander, wrote in a note yesterday that the Moody’s downgrade and lower earnings could cause a ripple effect on the company, raising borrowing costs and triggering collateral calls. “It also exposes MF to collateral calls of up to $5 million,” the note said. “We believe it could also prompt lenders to reduce financing, clients to withdraw assets and trigger the need to recognize losses on certain bilateral over- the-counter and off-balance sheet transactions." Well, judging by the bond yield chart below, MF is done (further confirmed by WSJ reports that the company has hired restructuring expert Evercore Partners). The only question is whether that ever so handy uber collateral puller, Goldman Sachs, so critical in the extinction of AIG and Dexia, will be the party responsible for the death of MF Global? Considering who the current head of MF is, and his "key man status [13]" in the prospectus of the company's recently bonds (which are plummeting today), we somehow doubt it.

[14
Will Goldman Be MF Global's Executioner With Terminal Collateral Calls, As Yields Explode?

The MasterMetals Blog

Friday, September 09, 2011

Global Currency Wars Sees Swiss Franc Devalue 8.5% Against Gold In Week | ZeroHedge

Gold in Swiss Francs

Gold in Swiss Francs – 5 Day (Tick)


Gold in Swiss Francs in Nominal Terms – 40 Years (Quarterly)
From zerohedge.com:
The Swiss franc’s 10% plummet against gold this week clearly shows how cash is far from ‘king’ and no fiat currency in the world, in any bank in the world can be considered a “safe haven”.
Gold is again becoming the sovereign of sovereigns and reasserting itself as the safe haven money and asset par excellence.
If the Swiss franc, long considered the safest fiat currency in the world, can devalue 10% in a week, then it can happen and likely will happen to other currencies as well.


Global Currency Wars Sees Swiss Franc Devalue 8.5% Against Gold In Week | ZeroHedge


Share
_______________________________________
Check it out on The MasterCharts

Thursday, June 16, 2011

The Collapsing Greek Income Statement, Or Why Greece Is Doomed

The Collapsing Greek Income Statement
zerohedge.com


With everyone focused exclusively on the Greek balance sheet, where apparently the market has now realized that you don't cure unmanageable debt with yet more debt (something the Troica will figure out just as soon as the eurozone breaks apart), a far more important statement is the country's P&L, or income statement. After all, if a country can not grow into its balance sheet with excess cash at the end of the day, all bailouts are completely irrelevant....
Egan-Jones', a rating agency that has proven infinitely better at predicting the future than Moody's or S&P, summary of what to expect:
End of the line - although Greece is likely to receive additional funds, those funds might be senior to existing debt and both creditors and Greece's patience is waning. The rise in interest rates is likely to place an unbearable burden on the issuer and the austerity measures will further pressure GDP. The Hellenic Statistical Authority cited an accelerated contraction in domestic demand and a fall in consumer expenditures with the decline.


We expect that Greece will be forced to restructure its debt within the next 2 to 18 months; it cannot sustain significant additional budget cuts, the tepid economy, restricted capital raising, and 20+% interest rates. Greece's stated debt is EUR329B, GDP is EUR230B, and the federal budget deficit is EUR3.8B before interest expense and EUR16.4B after interest expense. The country has failed to meet its initial deficit target of 8.1% of GDP for 2010 as agreed to under the joint IMF-EU bailout terms in May 2010.Meanwhile, Greek debt (currently the highest in the EU at 127%) is projected to reach 160% of GDP in 2011. Austria withheld funds due to Greece after claiming the country has failed to meet its spoken commitments for the EU bailout package


Share
_______________________________________
Check it out on The MasterCharts

Wednesday, April 06, 2011

is Spain decoupling from its fellow PIIGS?

Spain drifts away

FT Alphaville


Spot the odd one out:

"...even under a stressed scenario [budget overshoot, higher than expected bank recapitalization costs and the potential direct costs to Spain if other fiscally challenged euro area countries restructure their debt] Spain’s debt levels (86.7 per cent of GDP) are considerably lower than Greece (156 per cent), Ireland (120 per cent) and Portugal (heading for 100 per cent).
That reflects the fact that Spain went into the great recession with lower levels of government debt than other countries (36 per cent at the end of 2007) and, says Jenkins, that the Spanish cajas are not that big relative to size of the overall economy." - Evolution Securities


It’s Spain of course, which has decoupled from other members of the periphery over the past three months with its bond yields not only tightening against bunds but also falling outright (from a high of 5.45 per cent to just over 5 per cent today.
The question, of course, is whether this can be justified.
Enter Gary Jenkins of Evolution Securities who has taken a closer look at whether this decoupling can be explained underlying factors.
We look at Spain’s projected fiscal path and then introduce some ‘stressed’ scenario events such a budget overshoot, higher than expected bank recapitalization costs and the potential direct costs to Spain if other fiscally challenged euro area countries restructure their debt. We then see how this changes Spain’s fiscal position and if the deficit/debt levels still remain ‘sustainable’ which would largely justify the decoupling from other peripherals that has taken place lately.
That’s the methodology and now the results.

As you can see even under a stressed scenario Spain’s debt levels (86.7 per cent of GDP) are considerably lower than Greece (156 per cent), Ireland (120 per cent) and Portugal (heading for 100 per cent).
That reflects the fact that Spain went into the great recession with lower levels of government debt than other countries (36 per cent at the end of 2007) and, says Jenkins, that the Spanish cajas are not that big relative to size of the overall economy.
It seems to us that the affordability of Spain’s debt is largely down to internal rather than external factors. Default by other peripherals will not have a significant direct effect on Spain, although there may be indirect effects, especially from a potential Portuguese default given Spain’s close ties with its Iberian neighbour. The factors that will have significant effect on the sustainability of Spain’s debt are the final cost of bailing out the savings banks, which in itself seems manageable and even in combination with a weaker economy and/or fiscal slippage would probably leave the debt at sustainable levels. Having successfully moved away from the other peripherals it is important that the fiscal discipline and economic growth expectations are met to ensure that Spain can avoid any contagion impact, if as we expect, we witness multisovereign restructuring in 2013 and beyond.
Ah, the cajas and all the real estate exposure. Here’s what Jenkins has to say about that:
In the name of prudence we will however use Moody’s worst case scenario where it sees a need for capital injections of up to €120bn, or nearly 8% of Spanish GDP when looking at the possible cost to Spain. This number highlights the difference between Ireland and Spain. Both countries have been affected by real estate and construction bubbles that brought at least parts of the banking sector down with them when they burst in 2007/2008. The cost of Ireland’s bank bailout has reached about 45% of GDP including the €24bn further recapitalisation needs announced last week (although at least in theory some of this may be raised from the private sector or subordinated debt holders rather than from government funds), Spanish cajas may be in a weak position, but relative to the size of the overall economy their losses and potential losses remain manageable.
read the whole story here:FT Alphaville » Spain drifts away
_______________________________________
Check it out on The MasterCharts

Thursday, March 17, 2011

The Day The Yen Carry Trade Died | zero hedge

The Day The Yen Carry Trade Died | zero hedge


It's gotta hurt real bad now!!!


While everyone is staring in disbelief at the USDJPY, the real carry action is in the high yielding-YEN pairs, i.e., the development, high growing countries. And it's a massacre: ZARJPY, NZDJPY, AUDJPY - all are plunging far more than the USD. This is nothing short of a complete carry trade unwind. The implications: the cheapest recurring source of funding for risk assets - the Yen carry trade, is over. Those who managed to sell early on are lucky. The rest will get such an onslaught of margin calls tomorrow they may need to access the discount window (if Primary Dealers and the luckier banks). Many will be forced to sell assets to satisfy collateral requirements as ongoing sales of carry pairs push the Yen ever higher, and force ever more liquidity out of the market. And if the Yen carry trade is done, the question is when will the USD, which has also been a carry currency for some time, follow suit. And, once again, the most troubling observation is that the BOJ has not intervened. Our sinking feeling is that after pumping 50 trillion or so in money markets, the petty cash may be running quite low. In any case, ES opens in 2 minutes. Grab the popcorn now.


The Day The Yen Carry Trade Died | zero hedge

Share
_______________________________________
Check it out on The MasterCharts

Thursday, November 25, 2010

infographic: bailout mechanisms in Europe


As for those who still may be confused by how the various bailout mechanisms in Europe operate, we present to you this useful infographic by the Guardian.


http://the-masterblog.blogspot.com/2010/11/its-official-there-is-not-enough-money.html


Share this|
________________________

Saturday, August 21, 2010

Gold: The Enemy of Currencies

Gold: The Enemy of Currencies
Last week saw gold prices rise despite deflationary fears.
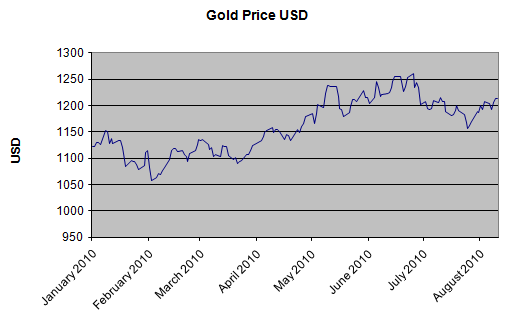
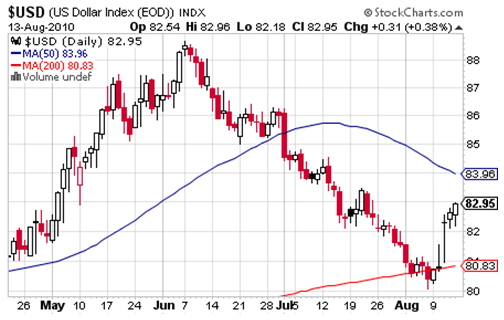
Taking a look at the chart below we can see the gold price in US dollars has traded in a narrow range since May. This is despite the dollar declining for much of that time, see chart further below. (Click to enlarge)
 

 We noted last week that we were going to keep an eye on the Fed Open Market Committee meeting in case they decided to increase the money supply even further. But they didn’t.

The Federal Open Market Committee failed to commit to anything... they didn’t say they would resort to more quantitative easing... they didn’t say they wouldn’t. Instead they’re pausing for breath.

The inflation, deflation debate continues 
As the deflationary, inflationary debate continues to be waged between financial heavyweights we stand on the side and watch. We’ve always believed the act of quantitative easing is inflationary; It inflates the money supply. We also think the governments only way out, of this huge debt burden it has imposed upon itself, is to inflate the debt. If you make the value of your debt less you have less to pay back, but it’s a juggling act. Inflate too much and you run the risk of hyperinflation, something that, the Germans will tell you, doesn’t bode well for an economy.

US Trade Deficit
What’s the next move for gold? We have to wait and see what happens around the globe to find that out. Certainly, its course is no longer dictated by the movement of the dollar as much as it once was. Will this relationship resurface? Probably, but when it does it will most likely be when the dollar makes a significant move, triggering panic in the dollar or gold.

Which is more likely – a panic or strength in the dollar?
Last week Bloomberg reported that the US trade deficit has swelled to an incredible figure:
“The U.S. trade deficit widened by $7.9 billion in June, the most since record-keeping began in 1992, to $49.9 billion, a report from the Commerce Department showed. Exports posted the biggest decline since April 2009.

“Investors should prepare for “major structural changes” as the global economy shifts to slower growth, Mohamed A. El- Erian, chief executive officer at Pacific Investment Management Co. said yesterday in a radio interview on “Bloomberg Surveillance” with Tom Keene.”

This news reverberated around the markets.

A quick look at the VIX index shows us that fear has reentered the market... again. At the far right of the graph you can see the index rises sharply which signifies a growing fear of volatility in the markets.


With a stuttering economy and growing tension between the US and China, the trade balance could play a huge role in a dollar devaluation. But in order for the dollar to drop further people will have to lose faith in its safe haven status. Which means an alternative currency will need to take its place. The problem with this scenario is that there aren’t too many other candidates for the role as a global reserve currency. And whilst that is the case gold can continue to take center stage.

Will things get better?
In the grand scheme of things the debt, from Dubai to Greece has just been shuffled around. The run up in the stock markets suggests stability but investors are cautious. They’re wondering if this is another ‘suckers rally’. And they’re right to be cautious. If you play with fire... well you know that old saying. In other words it doesn’t end well.
Can things get better? That depends on what governments do.

More money printing can only add to the attractiveness of gold. But gold is the enemy of currencies. As Alan Greenspan once noted, to control the dollar you have to control the gold price.

The fight for governments around the world is one which is traded in blows against the gold price. And should they win the price of gold may very well settle back to lower prices until supported by a strong level of jewelry demand. But this is dependent on currencies being kept under control. Both the US and the UK have not ruled out further money printing, and with each new wave of money the original currency is worth less and less.

It all sounds too reactionary to us. There doesn’t seem to be a grand plan. Maybe there cannot be as the markets lead themselves. But whatever the case, none of the actions by those in power have any finiteness about them. There’s no plan and no control.

Disclosure: No positions
http://seekingalpha.com/article/221174-gold-the-enemy-of-currencies?source=feed
Share |
_______________________________________
Check it out on The MasterCharts

Thursday, August 19, 2010

Bankruptcies: Going for broke | The Economist


Bankruptcies: Going for broke | The Economist: "Bankruptcies rise in America
Aug 18th 2010

BANKRUPTCY filings rose 20% in the year to June 30th compared with the previous 12-month period, according to statistics released on August 17th by the Administrative Office of the US Courts. This takes quarterly filings to their highest point since tougher bankruptcy laws were introduced at the end of 2005. That change brought a spike of bankruptcies, as companies and individuals rushed to declare themselves broke under the more lenient old regime. The data suggest that an older trend is reasserting itself. This is could be more bad news for America—or it could just mean that creative destruction is alive and well."

________________________

Thursday, August 12, 2010

U.S.-China Trade Gap Stirs Lawmakers - WSJ.com


U.S. Lawmakers Gear Up to Seek New Yuan Policy

WASHINGTON—The U.S. trade deficit with China in June hit its highest level in nearly two years and could spur congressional pressure on Beijing to revamp its currency policy.

America's trade deficit with China jumped 17% in June over the previous month to $26.2 billion, the biggest gap since October 2008. Earlier this week, China said its overall trade surplus hit $28.7 billion in July, an 18-month high.
Associated Press
A production line in Guangdong province, in southern China, in May.

The Commerce Department figures could set the stage for a fight in Congress this fall over China's currency policy. Some lawmakers, arguing that China has set the yuan artificially low to make its exports more price competitive on global markets, are keen to pass laws that would penalize countries that are found to be manipulating their currencies.

China, under pressure from the U.S. and other countries, announced a shift to a more-flexible exchange rate in June. But the yuan has appreciated less than 1% since then, and some economists say that it remains undervalued against the dollar by at least 25%.

While efforts to pass such legislation have made little headway, lawmakers and industry groups agree that the issue could gain traction in September, given that voters, who head to the polls in November, are angry about the country's continued weak economy and high unemployment rate.

A number of bills have garnered bipartisan support, including measures promoted by Tim Ryan (D., Ohio) and Patrick Murphy (D., Pa.) in the House, and by Charles Schumer (D., N.Y.) in the Senate.

These efforts would, among other things, make it easier for companies to seek import duties on goods from countries designated as having undervalued currencies. The Ryan-Murphy bill has more than 127 co-sponsors, including 37 Republicans.

Nadeam Elshami, a spokesman for House Speaker Nancy Pelosi (D., Calif.), said the House Ways and Means Committee would hold a hearing on the currency issue in September after Congress returns from summer recess.

"But no final decisions have been made on moving legislation forward," he said.

Sen. Sherrod Brown (D., Ohio), a co-sponsor of the Schumer bill and a member of President Barack Obama's Export Council, wrote Mr. Obama on Aug. 4, urging the administration to take tougher measures to address "unfairly subsidized exports" by countries such as China. Ten other senators signed the letter, including Republicans Jim Bunning of Kentucky and Olympia Snowe of Maine.

The Treasury Department on Wednesday declined to comment on the U.S.-China trade gap or China's currency policy.

Business groups are expected to intensify their lobbying on the issue, although they differ over whether punitive legislation aimed at China's currency policy is the best solution for narrowing the U.S.-China trade gap.

Augustine Tantillo, executive director of the American Manufacturing Trade Action Coalition, a Washington trade group representing U.S. manufacturers, says the group backs the Ryan-Murphy bill and is lobbying lawmakers, targeting those from Midwestern and Southeastern states with large manufacturing sectors and high unemployment.

"These trade surpluses aren't a result of happenstance," he said. "We're hoping concerns about job creation and the fall election environment will finally give us an opportunity to bring the legislation to a vote."

Erin Ennis, vice president for the U.S.-China Business Council, which represents U.S. companies doing business in China, said the window for China to "show it was serious" about addressing U.S. concerns about the yuan would close in September, when Congress returns to session.

But while Ms. Ennis expected the Chinese currency policy to be a major issue in the fall, "this isn't our member companies' top priority," she said.

Rather, she said that Congress and the administration should focus on reducing barriers to China's market and on the country's new "indigenous innovation" policy, which many Western companies say unfairly favors Chinese companies by promoting domestic innovation.
Write to Kathy Chen at kathy.chen@wsj.com
U.S.-China Trade Gap Stirs Lawmakers - WSJ.com
_______________________________________
Check it out on The MasterCharts

FT.com / FT's rolling global market overview - Investors take fright at Fed warning


Investors take fright at Fed warning

ByTelis Demos in London
Published: August 11 2010 09:04 | Last updated: August 11 2010 22:06
Wednesday 21.30 BST. US stocks are tumbling sharply as risky assets react to the Federal Reserve’s decision to downgrade its outlook while at the same time growth in other regions looks to be at its weakest for the year.
The Fed’s move to pump up a flagging recovery by buying Treasury bonds with mortgage-backed security proceeds has led to a rush to haven assets. The yen finally broke through to its strongest point since 1995 – at Y84.71 to the dollar, which it has been nearing for weeks.
With the Fed now a buyer of debt, some US government bonds saw record low yields, as did bonds in other markets as investors fled risky assets. An auction of 10-year Treasuries saw the lowest yield of any sale since January 2009.
Equity markets have been severely disappointed by the Fed’s downgrade of its outlook and in its rather tepid response to that outlook (the Fed’s balance sheet will not actually expand). The FTSE All-World stock index has fallen 2.7 per cent to late July levels, its strongest move since June, led by a 2.8 per cent decline in the S&P 500 index.
“The Fed delivered the minimum that had been expected,” said Hans Redeker, global head of foreign exchange strategy at BNP Paribas.“

The Market Eye

Markets saw a pillar of calm wobble today: the relatively high yields on 30-year debt.The recent trend has been of weakness at the back of the curve, suggesting investors were not expecting serious deflation. But today 30-year yields came in, and the spread with 10-years narrowed. It’s still near all-time record highs, so views haven’t shifted, only slid slightly. Plus, the move is likely short-lived, given the way that markets trade on Fed moves. Steven Major, head of fixed-income research at HSBC, says distortion is the rule-of-thumb in these situations:
“Given that this action by the Fed was well telegraphed, Treasury yields have moved lower in a move which is beyond what we expected,” he said. “The biggest moves tend to happen when markets are salivating about the prospects. Normally when an expected event happens, the reaction is a damp squib.”
Mr Major said that given the markets’ bearish tilt on the economy, yields on 10-year US Treasuries could fall as low as 2 per cent, from
2.69 per cent currently. That would blow the curve right back out to record levels.
A report that the US trade deficit widened again in June to 2009 levels sent its own shockwaves through markets. Combined with a slowdown in industrial production in China to two-year lows, and a drop in machine orders in Japan, it confirmed suspicions that the rest of the world would not be able to help the world’s biggest economy grow.
“Without earnings season holding us up, investors are focusing on the bad news,” said Jonathan Corpina, a senior partner at Meridian Equity Partners and trader on the New York floor. “We heard this language from the Fed on Tuesday. Really it was the combination with the numbers from China and the trade balance that put extreme pressure on our markets today.“
Crude oil’s decline also accelerated following a warning from the International Energy Agency that the Gulf of Mexico oil spill may restrict supply in 2011. It has slipped below $80 a barrel.
The fears for global growth were especially sharp in Europe, where oddly the dollar surged against the euro in spite of monetary loosening in the US.
“Investors are looking at Europe and saying, ‘I don’t care about policy tightness’. If the US has a real risk of weakness, then that raises risks for growth everywhere in the world,” said Eric Fine, manager of G-175 funds at Van Eck Global.
The euro is at its lowest level since before the bank stress tests last month. German 10-year Bunds are also at record low yield levels as “peripheral” European bonds from Greece and Spain are sold-off.
• Europe. Mervyn King, governor of the Bank of England, said in his inflation outlook that economic growth would slow to below-target levels. The UK also saw a stark drop in consumer confidence and fallingemployment growth. Like the Fed, the Bank announced that quantitative easing would continue, but not extended to new levels.
The FTSE 100 index dropped 2.4 per cent, falling further after Wall Street’s weak opening, but already weak following the UK’s dismal data and the Bank of England’s unwillingness to provide new monetary relief. Germany’s Dax closed down 2.1 per cent. Basic materials, closely tied to demand in China, and cyclical technology and financial shares are the laggard sectors.
• Asia. The Nikkei 225 average fell 2.7 per cent as the yen jumped following the Fed decision. A stronger yen has weighed on Japanese export companies. Japan also said that industrial orders rose only 1.6 per cent in July, versus a forecast of 5.5 per cent growth.
Chinese shares were also lower on the poorer industrial growth figures. The mainland Shanghai Composite index was down by 0.5 per cent and the Hang Seng index in Hong Kong dropped 0.8 per cent, falling lower as it neared the close.
• Currencies. The yen has since bounced off its low of Y84.79, and is now up 0.1 per cent at Y85.38. Considerations such as haven buying for the dollar, and the risk of Japanese intervention in the market, have kept the currency from rising further.
The euro is down 2.3 per cent at $1.2870, its steepest one-day drop since January 2009. It has given up all its gains following the well-received bank stress tests. The yen is surging 2.4 per cent against the euro to Y109.89.
The pound was hard-hit following a jobs report in which the decline in jobless claims slowed, and the Bank of England’s inflation report. Sterling is down 1.2 per cent, at $1.5665, after falling more than 1 per cent in the previous session.
The New Zealand dollar is off 1.2 per cent against the yen and the Australian dollar is down by 1.7 per cent against the US dollar. Both currencies closely track commodities and interest rates, which rise with growth hopes.
• Debt. The German 10-year Bund was the sharpest mover, with the yield falling 11 basis points to 2.43 per cent, a new record low.
Japanese 10-year yields fell 2 basis points to 0.999 per cent.
The yield on the US 10-year Treasuries is down 7 basis points to 2.69 per cent, off its lowest point since February 2009 hit earlier in the session. Five-year bonds, 7-year, and 2-year bonds also dipped to record-low yields, though they had recovered slightly as the session wore on.
Gilt yields also fell sharply, with 10-year bonds down 11bp to yield 3.14 per cent, their lowest since April 2009 following the Bank’s dovish outlook. An auction on Tuesday saw long-dated gilts pricing at below-market yields, though not strongly in demand by investors.
• Commodities. Benchmark crude oil is falling further past $80 a barrel, now at $77.51, down 3.4 per cent.
Gold, in one of the few signs of reassurance, is down just 0.5 per cent at $1,199 an ounce. Bullion interests investors as the risk of monetary inflation rises and the Fed’s relatively cautious move has evidently not sparked a change in fears of either inflation or deflation.
However, traders cautioned that big moves in gold may be muted by liquidations that raised cash for investors fleeing risk.
Follow the Global Market Overview on Twitter @telisdemos
(Jamie Chisholm is on holiday)

Wednesday, August 11, 2010

Is Gold Crash Proof This Time Around? | zero hedge

Is Gold Crash Proof This Time Around?

I’ve been receiving quite a few emails regarding the topic of Gold and how it will perform if another Crash hits. The following are my thoughts on this matter.

The first thing that needs to be said is that IF we have another systemic meltdown like that of Autumn 2008, Gold will likely go down along with everything else. There are simply too many big players (hedge funds, investment banks, etc) with heavy exposure to Gold who would be forced to liquidate their positions during a systemic collapse.

I know this is not what the Gold bugs want to hear, but during systemic Crises, just about every investment on the planet plunges while the US Dollar and Treasuries rally. Of course, this time around if another 2008-type event hits, it will undoubtedly involve or be focused on sovereign debt. So this raises the potential that Treasuries, particularly those on the long-end of the yield curve, could be hammered as well as all other assets outside the Dollar. This is worth keeping in mind for those who view Treasuries as a safe haven.

So if we go into a 2008-type event, Gold will fall. It will likely fall much less than other assets (stocks and industrial commodities), but it will still go down at least at first. This forecast is confirmed by the market action in 2008 as well as the market collapse from April 2010-July 2010. Both times Gold took a hit, but both times it came back quickly.

So if you’re heavily exposed to Gold, you’re going to need to think “big picture” or have a very strong stomach when the market Crashes.

Now, let’s take a look at the charts.

For starters, the number one metric you need to focus on in terms of determining Gold’s market action is the 34-week exponential moving average. Since the Gold bull market began in 2001, this has been THE support line for Gold.

As you can see, Gold has only broken below this line ONCE in the last ten years and that was during the 2008 systemic collapse. So take a note of this line and always watch where Gold trades relative to it.

Indeed, a significant break below this line that DOESN’T occur during a system Crash would be a MAJOR warning that the Gold bull market is in trouble. Remember, the ONLY time we took this line out before was during the systemic collapse in 2008. So a break below it WITHOUT a Crisis would be VERY bearish.

And if Gold breaks below this line on its own (without a Crisis) and then fails to reclaim it… well, then it would be SERIOUS time to reevaluate the Gold bull market story.

Because of its significance as THE support line for the Gold bull market, the 34-week exponential moving average also serves as an excellent gauge for determining when Gold needs to take a breather or correct.

Indeed, anytime Gold has stretched too far away from this line to the upside, it has usually staged a pretty sharp reversal to re-test this line. I’ve circled the most significant episodes of this from the last seven years in red on the chart below.

These are the BIG picture gauges and items to take note of: the points to remember in terms of determining where Gold is in its bull market and whether it’s an asset class you want to “buy and hold.”

Now let’s move into the more intermediate gauges and items relevant to determining Gold’s action from a trading perspective in the past and today.

Gold’s bull market of the last ten years has largely taken place within the confines of several very clear upward trading channels. Indeed, each “leg up” has featured Gold breaking above the upper trend-line of a given channel at which point said upper trend-line became the lower trend-line for the next trading channel (see below).

As you can see, the first “leg up” in Gold’s bull market took place from 2001 to late 2005. At that point Gold broke out of its old trading channel and entered its “next leg up” which took place from 2006-until early 2008 when the Bear Stearns crisis blasted Gold into yet another trading range.

The systemic Crash in Autumn 2008 brought Gold back down into a former range (the only time this happened in the last 10 years), but the precious metal bounced back quickly. It DID have some difficulty breaking into its final “leg up” and staying there this time around, but by mid-2009, Gold was again on a tear entering its highest trading range yet where it remains today.

You’ll note that the clear significance of these various trend lines have made for some great trading: virtually every test of a trend line to the upside or downside made for a good exit or entry point for a short-term trade.

As I write this, Gold is trading in a well-defined range between $1,150 and $1,300. Going by Gold’s action of the last 10 years, we could see the precious metal continue to trade in this range for a while without breaking out either way. This, of course, assumes we don’t have another systemic meltdown AND that the Gold bull market has plenty of more room to run.

The major indicators that could nullify this forecast are:

1) A break below the lower trend line WITHOUT a Crash

2) A break above the upper trend line that held

Regarding #1 [1], if Gold broke below its lower trend line without a systemic “episode,” it would represent the first time Gold broke to a lower trading range without systemic risk. That would be a MAJOR red flag to watch out for if you’re a Gold bull.

Conversely, a significant break above $1,300 would signal yet another “leg up” has begun and would a MAJOR sign that the Gold bull market has plenty of more room to run.

A final significant move to watch for would be if Gold were to collapse into a lower trading range as a result of a Crash and NOT break out again. Even during the 2008 disaster, Gold was back to re-testing its upper trend line within a few months. So if another systemic Crash hits and Gold doesn’t bounce back quickly that’s ALSO a major warning sign that the Gold bull market is in trouble.

We’ve covered a lot of ground here, so I’ll close this article by listing the main points of this article:

1) “buy and hold” Gold investors MUST focus on the 34-week exponential moving average (currently $1,158). A break below this level WITHOUT a Crash is BAD NEWS.

2) Traders should focus on Gold’s trend lines for determining entry and exit points. Currently the trend lines are $1,300 on the upside and $1,150 on the downside.

A break below $1,150 WITHOUT a Crash would be a MAJOR warning to the bulls. So would a break below $1,150 WITH a Crash that wasn’t quickly followed by a strong bounce back and re-test of the upper trend line.

Good Investing!

Graham Summers

PS. to get more in depth market analysis and find out about a proprietary "buy and hold" trading trigger that has caught both major "legs up" in Gold AND avoided the

2008 Crash, you can join me at www.gainspainscapital.com.


Is Gold Crash Proof This Time Around? | zero hedge

Friday, July 23, 2010

Hypo Fails, All Other German, Portuguese, French Banks Pass Test

Tyler Durden
Subject: Hypo Fails, All Other German, Portuguese, French Banks Pass Test

And we uncover that the German Landesbanks (the equivalent of the bankrupt
Spanish cajas) did their own stress tests. Time for the PPT to step in with
this pretext and soak up all offers. Totally pathetic BS.
Update 1: Somehow Bank of Ireland "passes" the test but needs over €2
billion in extra equity... uhm... WTF??? This is the point where the
audience rushes the stage and burns the theater down.
Update 2: 5 Spanish cajas, 1 German and 1 Greek banks are eliminated on
their quest to marry the US taxpayer. 84 other banks will soon be the
recipients of far more US taxpayer generosity. And with that the season
finale of the farce comes to a close.
Description: http://feeds.feedburner.com/~r/zerohedge/feed/~4/f6DsejiAiBk

View article...
Hypo Fails, All Other German, Portuguese, French Banks Pass Test | zero hedge

ShareThis

Gold or Silver?

MasterSearch