MasterSearch

Showing posts with label stocks. Show all posts

Friday, June 12, 2020

$VIX Explodes as the Market Crashes

VIX
Yet markets recovering in early Asian trading...


Share
_______________________________________
Check it out on The MasterCharts

Tuesday, February 11, 2014

Moving averages point the way for #gold, #silver stocks Investor

$GDX, $GDXJ and $SIL could soon test moving averages which have been resistance for the past 13 months.

Moving averages point the way for gold, silver stocks

Resource Investor 
The gold and silver stocks have rebounded nicely but have consolidated in recent weeks. Where is this going and how do we know? Well, a few weeks ago we publicly said that a major bottom is in. Thus, we believe the trend will go higher. Beyond belief, we need real confirmation that the sector will continue higher. Enter moving average analysis. By using a few simple moving averages we can better understand the current context and get confirmation that the sector will continue to move higher. GDX, GDXJ and SIL could soon test moving averages which have been resistance for the past 13 months.
First lets start with GDX. The 150-day moving average provided resistance at the start of 2013 and then the market declined and remained below its 50-day moving average for months. The 150-day moving average provided resistance again after the June bottom. Now that the market has reclaimed the 50-day moving average which has turned up, it is in position to break above the 150-day moving average which is flat and no longer declining. Keep an eye on the RSI which should push above 70 to confirm a breakout. Upon breakout, the medium term target becomes $31.

There is a similar picture in GDXJ. The market failed at the 150-day moving average in January 2013 and then remained below the 50-day moving average until August. The summer rally failed at the still declining 150-day moving average. Now GDXJ has reclaimed the now rising 50-day moving average and is in position to breakout above the 150-day moving average. The RSI recently hit 70 and has remained above 50 during this consolidation. It definitely needs to push above 70 in a breakout scenario. In the breakout scenario the medium target becomes $51.

For SIL and the silver stocks we use the 200-day moving average. That average provided support in November 2012 but then resistance in February 2013 and then for the summer rebound in August 2013. SIL has now reclaimed the 50-day moving average and is in position to retest the 200-day moving average. Again, look for the RSI to confirm the breakout. In that scenario, the next resistance target becomes $16.50.

The near-term analysis is quite simple. The 50-day moving average appears to have become strong support for these markets which appear ready to test what has been resistance over the past 13 months. Note how that resistance (the moving averages) is no longer declining but is flat or flattening. That illustrates how the downtrend is all but over. A strong close above the moving averages will all but confirm that the downtrend is over and could more importantly lead to some very strong moves. GDX at $24 has an upside target of $31. GDXJ at $37 has an upside target of $51 while SIL at $12.50 has an upside target of $16.50. Keep an eye on these markets as a breakout above these moving averages would be quite significant. If you'd be interested in learning about the companies poised to outperform the sector, then we invite you to learn more about our service.
Jordan Roy-Byrne, CMT, can be contacted at Jordan@TheDailyGold.com.

Wednesday, May 29, 2013

The Utility Average $DJU has crashed since its recent high

The Utility Average has a history of topping out simultaneously or with a few month's lead over the whole market.  Look at the chart


Monday, December 19, 2011

Gold and Stocks Signal Start of a Bear Market for 2012 :: The Market Oracle

Gold and Stocks Signal Start of a Bear Market for 2012

Stock-Markets / Financial Markets 2012 Dec 18, 2011 - 12:22 PM
Last week saw a severe breakdown in the Precious Metals sector that is now viewed as marking the start of a bearmarket, and that means the onset of a deflationary episode that is likely to prove more serious than that we witnessed in 2008, because it will involve countries going bust rather than "just" banks and large corporations as was the case in 2008.
At first glance gold's 3-year chart still doesn't look too bad, with its price in the vicinity of a still rising 200-day moving average, but last week it broke below this average for the first time since 2008, which is in itself a serious warning, and ominous devolopments on the charts for silver and the Precious Metals stocks indices, strongly suggest that gold is in the process of completing an important top area, which looks like it is taking the form of a bearish Descending Triangle. Momentum as shown by the MACD indicator, is now firmly in negative territory, and failure of the important support level at the lower boundary of the suspected Descending Triangle will lead to a severe decline as shown.
Gold 3-Year Chart
The Market Vectors Gold Miners Index (GDX) broke down last week from the Diamond formation that we had identified a week or two ago, confirming that the pattern that has developed this year is a large top area. This being so it is clear that both gold and silver are in the late stages of large top areas from which they are both soon likely to break down, and also that a major deflationary episode is in the works that will see the still elevated broad stockmarket suffer a severe decline, probably similar to that which occurred in 2008. The breakdown in the GDX was a very serious bearish development, so any rallies arising from the current oversold condition are likely to meet heavy selling and are thus unlikely to get far. Whatever rallies now occur should be aggressively sold - the real downside fireworks are likely to occur in the New Year.
Market vectors Gold Miners 2-Year Chart
On the 5-month chart for the GDX index we can clearly see the fine example of a rare "Fish Head" Triangle, which is what enabled us to call an imminent big move in the sector last weekend, although at the time we did not know which way it would break. To enable those readers less endowed with imagination to spot the Fish Head pattern, an eye and mouth have been added to the chart. We placed a general stop beneath this Triangle which took us out of most positions, and a straddle was recommended for speculators which has already garnered big profits.
Market vectors Gold Miners 5-Month Chart
At the same time that the PM sector started breaking down last week, the dollar broke out above an important resistance level, negating a potential Double Top, as we can see on its 6-month chart below, although the breakout is not as yet by a decisive margin. This has opened up the possibility of another strong upleg by the dollar, which is of course what we would expect to see if deflation strikes.
US Dollar Index 6-Month Chart
How far could the dollar rally? The 5-year chart gives us a good idea - it could run swiftly to the 88 - 89 area during a major deflationary episode.
US Dollar Index 5-Year Chart
A big dollar rally of course implies further euro weakness. As we can see on the 5-year chart for the euro, it has just broken down from a Head-and-Shoulders top and could drop back swifly to the vicinity of its 2010 lows in the 120 area or even lower. This implies further turmoil in Europe early next year, which is hardly surprising given the disorderly crew who are running Europe. Actually, it is surprising that the euro is not a lot lower considering what has gone down in Europe in the recent past - it would appear that the markets have been hanging in and hoping for a solution - tough luck if one isn't forthcoming.
Euro 5-Year Chart
If the PM sector is signaling a major deflationary episide, then we should see signs of topping action in the broad stockmarket, and we do. A large Head-and-Shoulders top is completing in the S&P500 index, and with the index high in the Right Shoulder we are believed to be at an excellent point go short, buy bear ETFs etc, which we will be reviewing on the site shortly. One leading market commentator who actually has a very good track record recently said that the markets will continue higher "because people are going to continue getting up in the morning and going out to work in order to buy stuff for themselves and their families". Oh, is that right? - try telling that to the 50% of Spanish youth who are out of work and can't find it no matter how hard they try BECAUSE THE JOBS DON'T EXIST due to the economy of Spain being ravaged by deflation, aggravated by the bursting of a huge property bubble - and what about American workers in the early 30's? - they didn't go around asking "buddy can you spare a dime?" because they were lazy ****ers - they were likewise the victims of deflation.
This same writer portrayed the 2008 market meltdown as a "once in a lifetime event", implying that everything's OK now and that "the great bull will climb the wall of worry". That might be so if the problems exposed by the 2008 financial crisis had been properly dealt with, but they weren't, they were simply "swept under the rug" - papered over with more of the stuff that created the problems in the first place - debt and derivatives - which means that the forces of deflation have now built up to staggering proportions - the lamed zombie banks, who exist now only to line the pockets of their elite executives and sluice fuinds in the direction of favored politicians, and governments nursing monumental debt overhangs are now powerless in the face of the oncoming deflationary train wreck. The final denouement will be when bond markets crash and interest rates skyrocket - that's when creditors will finally get the message that they are not going to get a penny back. One big reason for the current procrastination is that big private creditors are scrambling to use the current window of opportunity to offload as much bad paper as possible onto governments and thus the taxpayer before the final collapse.
S&P500 3-Year Chart
Let's stand back a moment now to consider the larger implications of all these developments on the charts. The breakdowns now occurring across the PM sector are an indication that the forces of deflation are set to assert themselves and come to the fore. These forces have always been there, lurking in the background since the first major deflationary convulsion back in 2008, and their intent is to cleanse the world economic system of the dross of the gargantuan debt and derivatives overhang that is bringing the world economy to a dead stop. The key point to understand here is that these forces may be kept at bay for a while but they cannot be stopped - and creating even more debt and derivatives in an effort to stave off their impact, which is what central banks and governments have been doing since 2008, simply creates a more disastrous situation later on. Thus the accelerated ramping of the money supply and the maintenance of "zombie banks" and the propping up of bond and stockmarkets is an open invitation to disaster on a massive scale. There is still a widespread assumption that somehow "they" will fix it, they will muddle through by creating money out of nothing, juggling things around and engaging in firefighting where deflation threatens to break out and we will eventually come out of the end of the tunnel. We have even fallen for this ourselves having been fooled temporarily by the COTs and other data which it has to be said may be being tampered with. The problem is that the continued increases in debt and derivatives have created a situation that is dangerously unstable and now increasingly out of control. There is also a widespread assumption that that the entrenched powers that be, Goldman Sachs, the Republican Party etc are unassailable and immortal - that's what the Tsar of Russia and his family thought before they were summarily shot by the Bolsheviks in 1918. Nothing is forever.
2012 is going to suck - it probably won't be as bad as the movie "2012", but it's going to suck. Prepare yourselves as best you can - that's what we are going to do on www.clivemaund.com
By Clive Maund
CliveMaund.com
For billing & subscription questions: subscriptions@clivemaund.com
© 2011 Clive Maund - The above represents the opinion and analysis of Mr. Maund, based on data available to him, at the time of writing. Mr. Maunds opinions are his own, and are not a recommendation or an offer to buy or sell securities. No responsibility can be accepted for losses that may result as a consequence of trading on the basis of this analysis.
Mr. Maund is an independent analyst who receives no compensation of any kind from any groups, individuals or corporations mentioned in his reports. As trading and investing in any financial markets may involve serious risk of loss, Mr. Maund recommends that you consult with a qualified investment advisor, one licensed by appropriate regulatory agencies in your legal jurisdiction and do your own due diligence and research when making any kind of a transaction with financial ramifications.
Clive Maund Archive

© 2005-2011 http://www.MarketOracle.co.uk - The Market Oracle is a FREE Daily Financial Markets Analysis & Forecasting online publication.
Gold and Stocks Signal Start of a Bear Market for 2012 :: The Market Oracle :: Financial Markets Analysis & Forecasting Free Website

Monday, July 25, 2011

S&P Returns since 2001 Featured Charts

S&P Returns since 2001 Featured Charts


dshort Featured Charts

Share this|
________________________ The MasterBlog

Wednesday, May 11, 2011

Short Interest NYSE vs SPX

Short Interest NYSE vs SPX


courtesy of zerohedge.com

Share this|
________________________
The MasterBlog

Wednesday, April 06, 2011

As usual, Gold’s rally dismissed by equity bulls

Gold’s message dismissed by equity bulls- of course they're not in!!!

By Jamie Chisholm, Global Markets Commentator
Published: April 4 2011 05:40 | Last updated: April 6 2011 13:57
Wednesday 12.35 BST. Pretty much every major asset class is going up as traders seem to be having a final splurge before the age of ultra-loose monetary policy comes to an end.
Underlying optimism about the global economy is emboldening bulls, while signals flashing inflation warnings are being dismissed.
The FTSE All-World equity index is up 0.4 per cent to a fresh cyclical high, after Asian exchanges – Japan aside – shrugged off China’s out-of-hours monetary tightening.
US stock futures are up 0.7 per cent, and the FTSE Eurofirst 300 is higher by 0.5 per cent, helped by stronger than expected German factory orders in February.
Gold is up 0.6 per cent to $1,458 an ounce having hit a record of $1,461, while silver is at a fresh 31-year high of $39.62.
The sharp rise of late for bullion is supposedly being predicated on fears of building inflation pressures – US 5-year breakeven rates, a gauge of inflation expectations, are above 2.4 per cent, the highest since July 2008. And it is true that many commodities are challenging record levels.
Brent crude on Tuesday breached $122 a barrel for the first time since August 2008 as the conflict in Libya combined with worries about production out of Nigeria and Gabon to increase concerns about supply disruption at a time of increasing demand.

Factors To Watch

With oil at 30-month highs, US energy inventory data published at 15.30 will be eagerly scanned by traders.
And corn hit a record of $7.7075 a bushel on Tuesday, up 15 per cent in four days, adding to fears that higher food prices could exacerbate civil unrest in poorer countries. US-traded corn is currently down 0.7 per cent at $7.6150.
However, core bond yields are little changed on the session, suggesting the market is being somewhat selective in its immediate rationale for pushing various asset prices higher.
Indeed, it is possibly a misjudgement to assume that bullion’s rise reflects inflation concerns. Other factors cited by analysts and commentators over recent days for the strength in precious metals have included: worries over the eurozone; geopolitical problems; Japan’s nuclear woes; and even the possible US government shutdown.
But none of these issues seem to be having any lasting impact on other risky assets, so it would be strange if their influence was being applied to bullion alone.
Meanwhile, any traders who shorted industrial metals after Tuesday’s China rate rise will be smarting. A weaker dollar on Wednesday and hopes that Beijing may be coming to end of its tightening cycle has pushed the complex higher, with copper up 1.6 per cent to $4.33 a pound. Speculators remain wedded to the “reflation trade” even as commercial heavyweights warn that demand is slowing.


read the rest here: FT.com / FT's rolling global market overview - Gold’s message dismissed by equity bulls
Related articles:
Share
_______________________________________
Check it out on The MasterCharts

Tuesday, March 15, 2011

We’ve Taken Out All Trendlines

We’ve Taken Out All Trendlines

Things are getting VERY ugly in the financial markets. Indeed, we’ve taken out virtually every trendline that supported the markets from the 2008 Crash.
First off are the emerging markets: trendline broken and retest failed.
Same goes for THE commodity play: Brazil:
And the “growth miracle” China:
Here in the US, the S&P 500 has taken out the trendline that supported it from the end of September onwards:
The US Dollar has ALSO taken out its long-term trendline:
In plain terms, the financial system is RED ALERT. The question now is if additional liquidity can prop this giant house of cards up anymore.


We’ve Taken Out All Trendlines

_______________________________________
Check it out on The MasterCharts

Friday, February 18, 2011

Banks and investment firms have rebounded fastest since March 2009 lows

Chart of the day: Barclays and Lloyds soar since lows

Kit Chellel
18 Feb 2011
4068036725_c300,200,50,50,100.gif

How financial firms in the FTSE100 have performed since the lowest point of the crisis
Two weeks from today is the second anniversary of one of the darkest moments of the financial crisis, when the FTSE 100 fell to a new low and Barclays shares were going for as little as 81p.
On that day, March 3, 2009, the 100 largest companies in the UK were worth less than they were when Tony Blair was elected in 1997.
The FTSE 100 has not hit such depths since, and an equities rally over the past few months has seen the index recover to somewhere near two-year highs.
Figures compiled by Financial News show that banks and investment firms have rebounded fastest, albeit from a lower level.
An investor who bought shares in the 10 financial firms (excluding insurers) currently in the FTSE 100 back in March 2009, would have seen a return of 149% in those two years, based on prices on Thursday morning.
This compares to an average of 73% across the FTSE 100 index.
An investor who backed Barclays would have done even better. The bank, which avoided a government bailout by tapping up Middle Eastern oil money, has risen a staggering 311% in the same period.
Lloyds is up 205% and private equity group 3i 182%.
The worst performer was investment group Alliance Trust whose shares rose 58.8%, which is below the FTSE average.
Second from bottom among the financial firms was Man Group which has been beset by problems since the crash. The listed hedge fund has seen half its assets under management pulled out by investors since the start of the crisis. Despite this, its shares have still gained 92 per cent between March 2008 and now.
The share gains achieved by banks are all the more impressive given that Barclays, HSBC, Lloyds and RBS all carried out multi-billion pound share issues to recapitalise following the crisis, diluting the value of stock.
The FTSE 100 index closed at 6087.38 yesterday, helped by strong performance from Lloyds TSB (up 2.9%) and RBS (up 3.8%). However the index remains some way below the pre-crisis peak of 6721.60 on September 31, 2007.


http://www.efinancialnews.com/story/2011-02-18/barclays-and-lloyd-best-performing-shares-since-crisis-trough?utm_source=twitterfeed&utm_medium=twitter

Friday, December 17, 2010

Market timing - European Financial Risk Breaks Out- Sell signal?

 Market timing - European Financial Risk Breaks Out- Sell signal?

CONCLUSION: As our mark Steele points out below, European corporate financial risk is breaking out...this was a SELL signal last spring. Yet this time so far, there has been a definite lack of contagion. The elastic band is being tested.....

Relative Strength Filter
December 17, 2010
Research Comment
Mark Steele
(416) 359-4641
Assoc: Tiberiu Stoichita/Rahul Muralidhar
European Financial Risk Breaks Out
CLICK HERE for a printer friendly version of this report including research disclosures.


Figure 1: European Financial (Markit) and European Prime Broker (our .PrimeEU) Financial Default Risk; FTSE Global Banks


Source: BMO Capital Markets, Bloomberg, Thomson, Markit


· This morning, European corporate financial default risk breaks to the upside – Figure 1.

o This was a sell signal in the spring.

o This was a sell signal in November.

o This is a caution signal now.

§ What is different?

· If you carve out the too-interconnected-to-fail European prime brokers (our .PrimeEU index), and overlay this on the European Financial default risk chart, you see a definite lack of contagion.

o The core is solid.

o The caution, of course, comes as we assume that if overall European financial default risk continues to rise, then there will be a moment when the elastic band connecting the two (Figure 1 top) will force the too-interconnected-to-fail institutions into the fray.

§ Today, we get off with just a caution, but a big caution.

Friday, September 17, 2010

CNBC Market Blah, Blah ..Friday Look Ahead: Tech a Focus for Stocks Friday, as Gold Dazzles Investors

Friday Look Ahead: Tech a Focus for Stocks Friday, as Gold Dazzles Investors

Published: Thursday, 16 Sep 2010 | 9:10 PM E
By: Patti Domm
CNBC Executive Editor
Some good news from the tech sector could be a positive for stocks Friday.
Outside the New York Stock Exchange in lower Manhattan.
Photo: Oliver Quillia for CNBC.com
Outside the New York Stock Exchange in lower Manhattan.

Both Oracle and Research in Motion reported strong earnings after Thursday's bell. Separately, Texas Instruments boosted its $0.12 dividend by a penny and said it would buy back another $7.5 billion shares. All three stocks were higher in after-hours trading.
Stocks Friday morning could feel the effect of the quadruple expiration of futures and options. Traders expect the expiration to be low key at the open, and if anything, the impact should be slightly positive.
CPI, at 8:30 a.m., is expected to show a 0.3 percent increase in August consumer prices. Consumer sentiment is expected to improve slightly to a reading of 70, from 68.9 last month, but economists say the strong performance of the stock market this month could push that number a bit higher. August's sentiment reading was the second lowest of the year. Consumer sentiment is released at 9:55 a.m.
Stocks drifted on both sides of the unchanged mark Thursday. The Dow ended up 22 at 10,594, and the S&P 500 was off less than a half point at 1124.  The dollar weakened against the euro, and dollar/yen was barely changed after the Bank of Japan intervened to curb the yen's rise Wednesday.
"This intervention might have higher chances of succeeding, assuming we continue to see relatively acceptable U.S. economic data. That's the critical thing," said Boris Schlossberg of GFT Forex. "...as long as the idea of double dip keeps receding, Treasury yields should stabilize and go back up and that will be critical to dollar/yen."
On the other hand, if we see the 10-year yield move to 2.5 percent, or dip below 2.5 percent, I don't think any amount of money will stem the (dollar) decline," he said.
Barry Knapp, chief equities portfolio strategist at Barclay's, said the initial stock market reaction after a big intervention is often a short-term decline. "For the first couple of days, the market goes down a little bit..the first reaction is to look at the dollar," he said.
The view is "if the dollar is going up, that's bad for earnings, so sell it. Dollar's going down, that's good. That's a very simplistic approach. I don't think it's right at all," he said. "If you look back at 2003, when the Japanese were intervening dramatically, the initial reaction was that the stock market sold off, and then it regained its footing."
Knapp said the intervention at that time was about $360 billion, and he estimated this round could total $250 billion. The BOJ was reported to have bought more than $20 billion Wednesday.
"If somebody puts $250 billion into the markets, event though that money won't be buying riskier assets, it can trigger an effect," he said.
The impact on Treasurys could also be noticeable, he said. Traders have been speculating the Japanese will park their dollar holdings in shorter duration Treasurys. "Initially the Treasury curve steepens, but then that tends to drive investors who were in 2s and 5s to extend out the curve and it starts to flatten. Then it triggers a whole position rebalancing."
All that Glitters
Gold continued to dazzle investors Thursday, scoring its second record settlement of the week. Investors are betting it could try to break the $1,300 level, maybe even as early as next week depending on the outcome of the Fed's meeting Tuesday.  Gold Thursday rose about a half percent to settle at $1273.80.
Gold has faced some high-profile criticism this week, including from investor George Soros who called it a bubble. "If you think about a world where every major country is trying to find a way to devalue its currency, gold looks pretty good in that environment. Personally I think the dollar is going down more. There's lots of reasons why gold will continue to rise. I don't know if I'd buy it, but I know I wouldn't short it," Knapp said.
 http://www.cnbc.com/id/39223276

Wednesday, September 01, 2010

Demonised ‘algos’ push the surge in FX trading - FT.com

Oh, poor "Demonized Algos" !!!

Demonised ‘algos’ push the surge in FX trading

By Jennifer Hughes, Senior Markets Correspondent
Published: September 1 2010 00:04 | Last updated: September 1 2010 00:04
Since the infamous stock market “flash crash” of May 6, high-frequency, or algorithmic, trading has been unwillingly dragged into the political and regulatory limelight.
forex-trading-graphicSo far, however, attention has focused on the role of these high-speed traders in the equity market. Outside the glare of that publicity, it is less well known that on May 7, FX trading volumes reached records, straining the plumbing of these markets.
Some participants argue these strains were partially caused by algorithmic, or algo, traders.
Exactly how much of this can be attributed to algo trading is unclear. However, there is no question that high-frequency traders are a fast-increasing force in FX markets, which is sparking a fierce debate as to their value to the market.
On Tuesday, the Bank for International Settlements reported that average daily turnover in the FX market has jumped 20 per cent in the past three years to $4,000bn a day. Its survey was taken in April, so missed the May spike, which related to the eurozone sovereign debt crisis.
The BIS-reported gains were led by a near 50 per cent leap in spot trading – deals for immediate delivery – to $1,500bn a day. This jump was powered by increased activity from “other financial institutions”, a group that includes hedge funds, pension funds, some banks, mutual funds, insurance companies and central banks. This will also include algos.
While all categories of “other” could have increased their trading, it is likely a significant proportion was driven by algo traders, who favour the deep, liquid spot markets and particularly currency pairs such as eurodollar and dollar-yen, which between them account for 42 per cent of all currency trading.
The question for the FX market is whether high-frequency dealers improve the market by adding liquidity, or whether they are instead merely price takers who contribute little.
“Algos have been demonised, but they’re an important part of the growth story,” says David Rutter chief executive of Icap Electronic Broking, which runs EBS, the main FX interbank trading platform. “What we’ve found is that they add pressure at each price point so that instead of getting big price gaps on shocking news, trade is more orderly.
“With FX, there are a lot of other flows such as global trade, so there is good underlying liquidity that the algos can enhance.”
Algos initially appeared in FX markets almost a decade ago, attracted by the deep liquidity and increasing use of electronic trading. They were generally welcomed, particularly by banks looking to build their prime brokerage businesses. However many banks soon grew disenchanted when they found the fast-moving shops were profiting from banks’ own slow systems by exploiting brief, tiny price differences between rival platforms.
Some banks went as far as ejecting offenders from their platforms but banks’ views have since become more nuanced. They have generally reached an accommodation, helped by technological improvements which make it easier to monitor client dealings and offer client-specific prices.
“The facts are that algos have made the markets more efficient and have helped ensure there’s one virtual price,” says Jeff Feig, global head of G10 FX at Citigroup. “They do cause banks to be smarter and we’ve had to work harder to be more efficient, but that’s ultimately to the advantage of the end user.
“I think that to some extent, algos have pushed banks and the result has been enhanced transparency and increased liquidity.”
Algos mean many different things in the FX market. While high-frequency traders are the best known – typified by one senior banker as “five smart guys in a room in New Jersey,” – banks are increasingly adept at developing their own algorithms to make their internal FX deals more efficient. These “internalisation” trades too will have provided a boost to the BIS numbers.
Most players say algos are now a fact of life in currency markets.
Unlike the equity market, which is split into hundreds of stocks, they believe the FX world’s focus on a relatively small number of currency pairs means it would be far harder for a single group of participants to move the market significantly, intentionally or otherwise, as some watchers fear happened during the “flash crash”.
“Also trading can happen anywhere there’s an electronic execution system and a volatile market,” says Alan Bozian a former FX banker and now chief executive of CLS Bank, the FX settlement system. “The question is, which markets adapt well and I don’t think it’s necessarily the stock market.”
FX markets have proved generally good at adapting. Systems such as CLS, introduced years before the financial crisis, have helped minimise settlement risk and since May, participants have been working again to improve their processing systems to cope with increased volume.
Significantly, for a market that is very much built around a hub of big banks, the BIS report showed that, for the first time, interaction of the main banks with “other” financial institutions overtook trading between themselves.
This could be a pointer to the market of the future, where banks are likely to remain the hub, but as much for their trade processing abilities as for their liquidity.
This would allow the winners to build profitable volume without taking on huge trading risks – suiting the current regulatory mood.
“The banks want to continue being the price providers, but they’re getting much more interested in the infrastructure and improving that,” says Mr Bozian. This evolution is likely to apply to high-frequency trading too.
Mr Rutter believes algos are only in their “late teens” in terms of development. “The early algo trading was about super-fast dealing and chasing inefficiencies. That’s largely gone,” he says.
“Now its about math and science being thrown at the market – there’s a rich pool of data and I think we’ll see algos evolve so its not just about milliseconds, but about longer-term predictive math.”
"FT" and "Financial Times" are trademarks of the Financial Times. Privacy policy | Terms


FT.com / Currencies - Demonised ‘algos’ push the surge in FX trading

Share
-- The MasterFeeds

Monday, August 30, 2010

MasterTech: RIM = RIP ? Research in Motion Continues Its Downwa...

RIM = RIP ?

Sounds like TAPS in the background....

Between the pressure on the corporate side of the business from governments who want access to all the data passing through the blackberries in their countries, and the real risk of migration by consumers to the iPhone and Android OS, the future doesn't look too bright RIM...

Below are charts.  The whole story can be seen on The MasterTech Blog or directly on zerohedge.com.
As Research in Motion Continues Its Inevitable Downward Descent In Both Equity Value and Market Share, Investors Should Tweak Their Assumptions Accordingly
Research in Motion's recent equity share decline stems not only from market share loss, but from the apparent lack of a clear cut and believable plan to stem that market share loss.

Research in Motion, is still currently the market leader in terms of share, but is losing both demonstrably and rapidly in new users. As a matter of fact, if the recent historical trends persist, this is the last quarter that RIM will be able to claim the top of the market title as Android looks well situated to claim that crown.


As can be seen from this chart, Android is just about there. Apple will probably show better numbers in Q3 with additional evidence of iPhone 4 adoption as well.
So, although RIM is looking quite cheap now, it is quite possible for it to look much cheaper. The question is how does this market share loss factor into its equity valuation.


MasterTech: Research in Motion Continues Its Inevitable Downward Descent In Both Equity Value and Market Share

_______________________________________
Check it out on The MasterCharts

Wednesday, August 25, 2010

Richard Russell's Daily Letter

August 24, 2010 - "I place economy among the first and most important virtues and public debt as the great danger to be feared. To preserve our independence, we must not let our leaders load us with perpetual debt. We must make our choice between economy and liberty, or profusion and servitude." Thomas Jefferson. 
...................................................................................


Throw a tennis ball up in the air, and it will lose upward momentum as it rises. At some point upside momentum will completely fade, and the ball will stand still in mid-air. After standing still for a brief moment, the ball will head back toward earth.


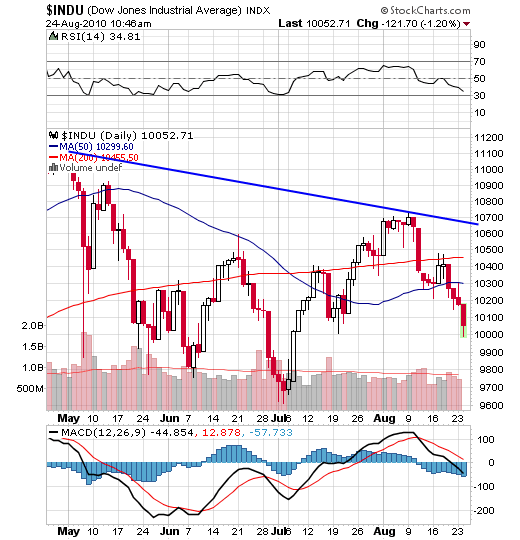
Somehow, I get the same feeling about the stock market. The market gained initial upside momentum as it surged up from its July low. By early August the market had lost upward momentum. For seven days the Dow moved sideways as if suspended in midair. On August 11, the market suddenly plunged 265 Dow points, and in so doing it fell out of its sideway trading range. From there, the Dow whipped back and forth, and by August 19, the Dow had fallen bearishly below both its 59-day and 200-day moving averages.


The daily chart below shows us what the Dow looks like now. Note that RSI is heading down, and MACD has turned negative. At the same time, the Dow is situated below its 50-day moving average, and the 50-day MA, in turn, is below its (red) 200-day MA. Finally, note that the Dow has assumed the form of a head-and-shoulders top that has now broken down. In all, a classic set of bearish relationships. 


I'm including a P&F chart of the Dow below. Note the latest red column of X's which just plunged below the 10150 box and below the rising blue trendline. According to this P&F chart, we received a "sell signal" this morning when the Dow broke below the preceding column of 0s and below it rising blue trendline. The P&F "projection" is that this break should take the Dow down to the 9750 box.


Incidentally, there is no shortage of "distribution days." The latest score for the last two weeks is -- 6 for the S&P 500, 5 for the Dow, 5 for the NASDAQ and 5 for the NYSE Composite. That's far too many, and it implies heavy institutional selling.
Yesterday, I wrote about the Treasury bonds. Every "smart" trader and investor has rushed into Treasury bonds as the ultimate save-haven area. I believe Treasury bonds and high-grade corporate bonds are in a bubble. There are just too many believers in bonds as the ultimate safe place to be. 


When everybody piles onto one side of the ship, the ship lists. And just as quickly, everybody rushes to the other side of the ship. That's where I think we are with bonds. 


The weekly chart below follows the 30-year T-bond. RSI tells us that the bond is overbought. The full stochastics at the bottom of the chart confirms that the bond is overbought. And the blue histograms are slanting downwards towards zero. All in all, I don't like the looks of the bonds. Any hint of rising interest rates could send the bond market off the edge of the popularity cliff. 


Gold -- I took today's stock market sell-off as an indication that business will be rotten in the months ahead. Rotten business will put pressure on the Fed to print, print, print. Wide open quantitative easing will put pressure on the dollar, and this, in turn, will put UPWARD pressure on gold. And gold may have started to discount that situation today.


Share |
_______________________________________
Check it out on The MasterCharts

Friday, August 20, 2010

If This Were A Stock....

If This Were A Stock....


By Guy M. Lerner
TheTechnicalTake
http://thetechnicaltakedotcom.blogspot.com/
See figure 1 a weekly price chart. The 40 week moving average (i.e, red line) is
heading higher, and prices are trading above key pivot points, which are areas of
support (buying) and resistance (selling). In essence, this is a "beautiful" chart with
lots of momentum (i.e., note the breakout gaps). If this were a stock, the analysts
and pundits would be all over the "breakout" ---blah, blah, blah.
Figure 1. Price Chart/ weekly
But figure 1 isn't a stock, it is the yield on the 30 year Treasury, and the chart has
been turned upside down. What I hear and read is this move in Treasury bonds isn't
sustainable. A sub 3% yield isn't possible, but isn't that what "they" said about a sub 4%
yield? Which happens to be in the rear view mirror.
People still don't believe, and they are not interpreting the significance of the price
action correctly. Maybe if this were a stock people would be wowed by the price
action. But they aren't. For the record, figure 2 is a weekly chart of the yield on the
30 year Treasury bond (symbol: $TYX.X). Are the low yields of late 2008 the next
stop?

If This Were A Stock....

_______________________________________
Check it out on The MasterCharts

Thursday, August 12, 2010

FT.com / FT's rolling global market overview - Investors take fright at Fed warning


Investors take fright at Fed warning

ByTelis Demos in London
Published: August 11 2010 09:04 | Last updated: August 11 2010 22:06
Wednesday 21.30 BST. US stocks are tumbling sharply as risky assets react to the Federal Reserve’s decision to downgrade its outlook while at the same time growth in other regions looks to be at its weakest for the year.
The Fed’s move to pump up a flagging recovery by buying Treasury bonds with mortgage-backed security proceeds has led to a rush to haven assets. The yen finally broke through to its strongest point since 1995 – at Y84.71 to the dollar, which it has been nearing for weeks.
With the Fed now a buyer of debt, some US government bonds saw record low yields, as did bonds in other markets as investors fled risky assets. An auction of 10-year Treasuries saw the lowest yield of any sale since January 2009.
Equity markets have been severely disappointed by the Fed’s downgrade of its outlook and in its rather tepid response to that outlook (the Fed’s balance sheet will not actually expand). The FTSE All-World stock index has fallen 2.7 per cent to late July levels, its strongest move since June, led by a 2.8 per cent decline in the S&P 500 index.
“The Fed delivered the minimum that had been expected,” said Hans Redeker, global head of foreign exchange strategy at BNP Paribas.“

The Market Eye

Markets saw a pillar of calm wobble today: the relatively high yields on 30-year debt.The recent trend has been of weakness at the back of the curve, suggesting investors were not expecting serious deflation. But today 30-year yields came in, and the spread with 10-years narrowed. It’s still near all-time record highs, so views haven’t shifted, only slid slightly. Plus, the move is likely short-lived, given the way that markets trade on Fed moves. Steven Major, head of fixed-income research at HSBC, says distortion is the rule-of-thumb in these situations:
“Given that this action by the Fed was well telegraphed, Treasury yields have moved lower in a move which is beyond what we expected,” he said. “The biggest moves tend to happen when markets are salivating about the prospects. Normally when an expected event happens, the reaction is a damp squib.”
Mr Major said that given the markets’ bearish tilt on the economy, yields on 10-year US Treasuries could fall as low as 2 per cent, from
2.69 per cent currently. That would blow the curve right back out to record levels.
A report that the US trade deficit widened again in June to 2009 levels sent its own shockwaves through markets. Combined with a slowdown in industrial production in China to two-year lows, and a drop in machine orders in Japan, it confirmed suspicions that the rest of the world would not be able to help the world’s biggest economy grow.
“Without earnings season holding us up, investors are focusing on the bad news,” said Jonathan Corpina, a senior partner at Meridian Equity Partners and trader on the New York floor. “We heard this language from the Fed on Tuesday. Really it was the combination with the numbers from China and the trade balance that put extreme pressure on our markets today.“
Crude oil’s decline also accelerated following a warning from the International Energy Agency that the Gulf of Mexico oil spill may restrict supply in 2011. It has slipped below $80 a barrel.
The fears for global growth were especially sharp in Europe, where oddly the dollar surged against the euro in spite of monetary loosening in the US.
“Investors are looking at Europe and saying, ‘I don’t care about policy tightness’. If the US has a real risk of weakness, then that raises risks for growth everywhere in the world,” said Eric Fine, manager of G-175 funds at Van Eck Global.
The euro is at its lowest level since before the bank stress tests last month. German 10-year Bunds are also at record low yield levels as “peripheral” European bonds from Greece and Spain are sold-off.
• Europe. Mervyn King, governor of the Bank of England, said in his inflation outlook that economic growth would slow to below-target levels. The UK also saw a stark drop in consumer confidence and fallingemployment growth. Like the Fed, the Bank announced that quantitative easing would continue, but not extended to new levels.
The FTSE 100 index dropped 2.4 per cent, falling further after Wall Street’s weak opening, but already weak following the UK’s dismal data and the Bank of England’s unwillingness to provide new monetary relief. Germany’s Dax closed down 2.1 per cent. Basic materials, closely tied to demand in China, and cyclical technology and financial shares are the laggard sectors.
• Asia. The Nikkei 225 average fell 2.7 per cent as the yen jumped following the Fed decision. A stronger yen has weighed on Japanese export companies. Japan also said that industrial orders rose only 1.6 per cent in July, versus a forecast of 5.5 per cent growth.
Chinese shares were also lower on the poorer industrial growth figures. The mainland Shanghai Composite index was down by 0.5 per cent and the Hang Seng index in Hong Kong dropped 0.8 per cent, falling lower as it neared the close.
• Currencies. The yen has since bounced off its low of Y84.79, and is now up 0.1 per cent at Y85.38. Considerations such as haven buying for the dollar, and the risk of Japanese intervention in the market, have kept the currency from rising further.
The euro is down 2.3 per cent at $1.2870, its steepest one-day drop since January 2009. It has given up all its gains following the well-received bank stress tests. The yen is surging 2.4 per cent against the euro to Y109.89.
The pound was hard-hit following a jobs report in which the decline in jobless claims slowed, and the Bank of England’s inflation report. Sterling is down 1.2 per cent, at $1.5665, after falling more than 1 per cent in the previous session.
The New Zealand dollar is off 1.2 per cent against the yen and the Australian dollar is down by 1.7 per cent against the US dollar. Both currencies closely track commodities and interest rates, which rise with growth hopes.
• Debt. The German 10-year Bund was the sharpest mover, with the yield falling 11 basis points to 2.43 per cent, a new record low.
Japanese 10-year yields fell 2 basis points to 0.999 per cent.
The yield on the US 10-year Treasuries is down 7 basis points to 2.69 per cent, off its lowest point since February 2009 hit earlier in the session. Five-year bonds, 7-year, and 2-year bonds also dipped to record-low yields, though they had recovered slightly as the session wore on.
Gilt yields also fell sharply, with 10-year bonds down 11bp to yield 3.14 per cent, their lowest since April 2009 following the Bank’s dovish outlook. An auction on Tuesday saw long-dated gilts pricing at below-market yields, though not strongly in demand by investors.
• Commodities. Benchmark crude oil is falling further past $80 a barrel, now at $77.51, down 3.4 per cent.
Gold, in one of the few signs of reassurance, is down just 0.5 per cent at $1,199 an ounce. Bullion interests investors as the risk of monetary inflation rises and the Fed’s relatively cautious move has evidently not sparked a change in fears of either inflation or deflation.
However, traders cautioned that big moves in gold may be muted by liquidations that raised cash for investors fleeing risk.
Follow the Global Market Overview on Twitter @telisdemos
(Jamie Chisholm is on holiday)

ShareThis

Gold or Silver?

MasterSearch