See the whole article here: China Narrowly Averts Credit Bubble Pop With Latest Government Bailout Of First Domestic Bond Default | Zero Hedge
MasterSearch
Showing posts with label bonds. Show all posts
Wednesday, January 23, 2013
#China Narrowly Averts #Credit Bubble Pop With Latest Government Bailout Of First Domestic #Bond #Default | Zero Hedge
See the whole article here: China Narrowly Averts Credit Bubble Pop With Latest Government Bailout Of First Domestic Bond Default | Zero Hedge
Wednesday, April 06, 2011
is Spain decoupling from its fellow PIIGS?
Spain drifts away
FT Alphaville
Posted by Neil Hume on Apr 06 10:00.Spot the odd one out:
"...even under a stressed scenario [budget overshoot, higher than expected bank recapitalization costs and the potential direct costs to Spain if other fiscally challenged euro area countries restructure their debt] Spain’s debt levels (86.7 per cent of GDP) are considerably lower than Greece (156 per cent), Ireland (120 per cent) and Portugal (heading for 100 per cent).
That reflects the fact that Spain went into the great recession with lower levels of government debt than other countries (36 per cent at the end of 2007) and, says Jenkins, that the Spanish cajas are not that big relative to size of the overall economy." - Evolution Securities
It’s Spain of course, which has decoupled from other members of the periphery over the past three months with its bond yields not only tightening against bunds but also falling outright (from a high of 5.45 per cent to just over 5 per cent today.
The question, of course, is whether this can be justified.
Enter Gary Jenkins of Evolution Securities who has taken a closer look at whether this decoupling can be explained underlying factors.
We look at Spain’s projected fiscal path and then introduce some ‘stressed’ scenario events such a budget overshoot, higher than expected bank recapitalization costs and the potential direct costs to Spain if other fiscally challenged euro area countries restructure their debt. We then see how this changes Spain’s fiscal position and if the deficit/debt levels still remain ‘sustainable’ which would largely justify the decoupling from other peripherals that has taken place lately.That’s the methodology and now the results.
As you can see even under a stressed scenario Spain’s debt levels (86.7 per cent of GDP) are considerably lower than Greece (156 per cent), Ireland (120 per cent) and Portugal (heading for 100 per cent).
That reflects the fact that Spain went into the great recession with lower levels of government debt than other countries (36 per cent at the end of 2007) and, says Jenkins, that the Spanish cajas are not that big relative to size of the overall economy.
It seems to us that the affordability of Spain’s debt is largely down to internal rather than external factors. Default by other peripherals will not have a significant direct effect on Spain, although there may be indirect effects, especially from a potential Portuguese default given Spain’s close ties with its Iberian neighbour. The factors that will have significant effect on the sustainability of Spain’s debt are the final cost of bailing out the savings banks, which in itself seems manageable and even in combination with a weaker economy and/or fiscal slippage would probably leave the debt at sustainable levels. Having successfully moved away from the other peripherals it is important that the fiscal discipline and economic growth expectations are met to ensure that Spain can avoid any contagion impact, if as we expect, we witness multisovereign restructuring in 2013 and beyond.Ah, the cajas and all the real estate exposure. Here’s what Jenkins has to say about that:
In the name of prudence we will however use Moody’s worst case scenario where it sees a need for capital injections of up to €120bn, or nearly 8% of Spanish GDP when looking at the possible cost to Spain. This number highlights the difference between Ireland and Spain. Both countries have been affected by real estate and construction bubbles that brought at least parts of the banking sector down with them when they burst in 2007/2008. The cost of Ireland’s bank bailout has reached about 45% of GDP including the €24bn further recapitalisation needs announced last week (although at least in theory some of this may be raised from the private sector or subordinated debt holders rather than from government funds), Spanish cajas may be in a weak position, but relative to the size of the overall economy their losses and potential losses remain manageable.
read the whole story here:FT Alphaville » Spain drifts away
_______________________________________
Check it out on The MasterCharts
Tuesday, November 30, 2010
Your One-Stop Guide To Frontrunning Monday's Double POMO | zero hedge
Your One-Stop Guide To Frontrunning Monday's Double POMO
By Tyler Durden
Created 11/27/2010 - 13:04
On Monday, Brian Sack will go for an all-out onslaught of Netflix and Amazon shorts. For the first time ever the New York Fed will hold not one but two monetization procedures. Incidentally both will focus on the part of the curve that in the past two weeks has been performing best: the sides of the belly. The two operations, expected to be about $2 and $7 billion, will focus on bonds in the 10-17 Y and 2.5-4 Y sector. In keeping with the tradition of sharing with our readers the bonds that Sack will almost certainly end up monetizing, we present the 10 cheapest bonds that will likely end up being acquired on Monday. As the Fed is now the largest single holder of Treasurys [1](since the announcement of the SOMA reinvestment program on August 10, the NY Fed has purchased a total of $124bn Treasuries / TIPS: of the $105bn scheduled for the current month, the Fed has purchased $48bn per MS) expect to see increasingly more detailed analyses of the Fed's SOMA composition as cartoons about how to front run the Fed become increasingly more popular.
[2]
It is only fitting that on the near end, the bond most likely to be monetized is the just issued (November 8) PU8 [3] (3Y).
Below is a detailed summary of all QE2 OMOs via Morgan Stanley.
[4]
A detailed look at the long-side of Monday's second POMO:
[5]
The best cheat sheet available at the moment for future monetizations:
It is only fitting that on the near end, the bond most likely to be monetized is the just issued (November 8) PU8 [3] (3Y).
Below is a detailed summary of all QE2 OMOs via Morgan Stanley.
A detailed look at the long-side of Monday's second POMO:
The best cheat sheet available at the moment for future monetizations:
Thursday, November 25, 2010
infographic: bailout mechanisms in Europe
As for those who still may be confused by how the various bailout mechanisms in Europe operate, we present to you this useful infographic by the Guardian.
http://the-masterblog.blogspot.com/2010/11/its-official-there-is-not-enough-money.html
Share this|
Friday, September 17, 2010
CNBC Market Blah, Blah ..Friday Look Ahead: Tech a Focus for Stocks Friday, as Gold Dazzles Investors
Tags:
bonds,
China,
Commodities,
Euro,
Finance,
Forex,
futures,
Gold,
News,
stocks,
trading,
Treasuries,
Unemployment,
USA
Friday Look Ahead: Tech a Focus for Stocks Friday, as Gold Dazzles Investors
Published: Thursday, 16 Sep 2010 | 9:10 PM E
By: Patti Domm
CNBC Executive Editor
Some good news from the tech sector could be a positive for stocks Friday.
Photo: Oliver Quillia for CNBC.com Outside the New York Stock Exchange in lower Manhattan. |
Stocks Friday morning could feel the effect of the quadruple expiration of futures and options. Traders expect the expiration to be low key at the open, and if anything, the impact should be slightly positive.
CPI, at 8:30 a.m., is expected to show a 0.3 percent increase in August consumer prices. Consumer sentiment is expected to improve slightly to a reading of 70, from 68.9 last month, but economists say the strong performance of the stock market this month could push that number a bit higher. August's sentiment reading was the second lowest of the year. Consumer sentiment is released at 9:55 a.m.
Stocks drifted on both sides of the unchanged mark Thursday. The Dow ended up 22 at 10,594, and the S&P 500 was off less than a half point at 1124. The dollar weakened against the euro, and dollar/yen was barely changed after the Bank of Japan intervened to curb the yen's rise Wednesday.
"This intervention might have higher chances of succeeding, assuming we continue to see relatively acceptable U.S. economic data. That's the critical thing," said Boris Schlossberg of GFT Forex. "...as long as the idea of double dip keeps receding, Treasury yields should stabilize and go back up and that will be critical to dollar/yen."
On the other hand, if we see the 10-year yield move to 2.5 percent, or dip below 2.5 percent, I don't think any amount of money will stem the (dollar) decline," he said.
Barry Knapp, chief equities portfolio strategist at Barclay's, said the initial stock market reaction after a big intervention is often a short-term decline. "For the first couple of days, the market goes down a little bit..the first reaction is to look at the dollar," he said.
The view is "if the dollar is going up, that's bad for earnings, so sell it. Dollar's going down, that's good. That's a very simplistic approach. I don't think it's right at all," he said. "If you look back at 2003, when the Japanese were intervening dramatically, the initial reaction was that the stock market sold off, and then it regained its footing."
Knapp said the intervention at that time was about $360 billion, and he estimated this round could total $250 billion. The BOJ was reported to have bought more than $20 billion Wednesday.
"If somebody puts $250 billion into the markets, event though that money won't be buying riskier assets, it can trigger an effect," he said.
The impact on Treasurys could also be noticeable, he said. Traders have been speculating the Japanese will park their dollar holdings in shorter duration Treasurys. "Initially the Treasury curve steepens, but then that tends to drive investors who were in 2s and 5s to extend out the curve and it starts to flatten. Then it triggers a whole position rebalancing."
All that Glitters
Gold continued to dazzle investors Thursday, scoring its second record settlement of the week. Investors are betting it could try to break the $1,300 level, maybe even as early as next week depending on the outcome of the Fed's meeting Tuesday. Gold Thursday rose about a half percent to settle at $1273.80.
Gold has faced some high-profile criticism this week, including from investor George Soros who called it a bubble. "If you think about a world where every major country is trying to find a way to devalue its currency, gold looks pretty good in that environment. Personally I think the dollar is going down more. There's lots of reasons why gold will continue to rise. I don't know if I'd buy it, but I know I wouldn't short it," Knapp said.
http://www.cnbc.com/id/39223276
Wednesday, August 25, 2010
Richard Russell's Daily Letter
August 24, 2010 - "I place economy among the first and most important virtues and public debt as the great danger to be feared. To preserve our independence, we must not let our leaders load us with perpetual debt. We must make our choice between economy and liberty, or profusion and servitude." Thomas Jefferson.
...................................................................................
Throw a tennis ball up in the air, and it will lose upward momentum as it rises. At some point upside momentum will completely fade, and the ball will stand still in mid-air. After standing still for a brief moment, the ball will head back toward earth.
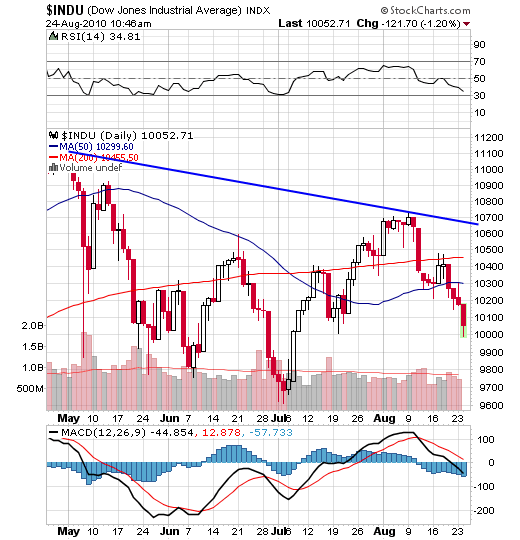
Somehow, I get the same feeling about the stock market. The market gained initial upside momentum as it surged up from its July low. By early August the market had lost upward momentum. For seven days the Dow moved sideways as if suspended in midair. On August 11, the market suddenly plunged 265 Dow points, and in so doing it fell out of its sideway trading range. From there, the Dow whipped back and forth, and by August 19, the Dow had fallen bearishly below both its 59-day and 200-day moving averages.
The daily chart below shows us what the Dow looks like now. Note that RSI is heading down, and MACD has turned negative. At the same time, the Dow is situated below its 50-day moving average, and the 50-day MA, in turn, is below its (red) 200-day MA. Finally, note that the Dow has assumed the form of a head-and-shoulders top that has now broken down. In all, a classic set of bearish relationships.
I'm including a P&F chart of the Dow below. Note the latest red column of X's which just plunged below the 10150 box and below the rising blue trendline. According to this P&F chart, we received a "sell signal" this morning when the Dow broke below the preceding column of 0s and below it rising blue trendline. The P&F "projection" is that this break should take the Dow down to the 9750 box.
Incidentally, there is no shortage of "distribution days." The latest score for the last two weeks is -- 6 for the S&P 500, 5 for the Dow, 5 for the NASDAQ and 5 for the NYSE Composite. That's far too many, and it implies heavy institutional selling.
Yesterday, I wrote about the Treasury bonds. Every "smart" trader and investor has rushed into Treasury bonds as the ultimate save-haven area. I believe Treasury bonds and high-grade corporate bonds are in a bubble. There are just too many believers in bonds as the ultimate safe place to be.
When everybody piles onto one side of the ship, the ship lists. And just as quickly, everybody rushes to the other side of the ship. That's where I think we are with bonds.
The weekly chart below follows the 30-year T-bond. RSI tells us that the bond is overbought. The full stochastics at the bottom of the chart confirms that the bond is overbought. And the blue histograms are slanting downwards towards zero. All in all, I don't like the looks of the bonds. Any hint of rising interest rates could send the bond market off the edge of the popularity cliff.

Gold -- I took today's stock market sell-off as an indication that business will be rotten in the months ahead. Rotten business will put pressure on the Fed to print, print, print. Wide open quantitative easing will put pressure on the dollar, and this, in turn, will put UPWARD pressure on gold. And gold may have started to discount that situation today.
Share |
Check it out on The MasterCharts
Friday, August 20, 2010
If This Were A Stock....
By Guy M. Lerner
TheTechnicalTake
http://thetechnicaltakedotcom.blogspot.com/
See figure 1 a weekly price chart. The 40 week moving average (i.e, red line) is
heading higher, and prices are trading above key pivot points, which are areas of
support (buying) and resistance (selling). In essence, this is a "beautiful" chart with
lots of momentum (i.e., note the breakout gaps). If this were a stock, the analysts
and pundits would be all over the "breakout" ---blah, blah, blah.
heading higher, and prices are trading above key pivot points, which are areas of
support (buying) and resistance (selling). In essence, this is a "beautiful" chart with
lots of momentum (i.e., note the breakout gaps). If this were a stock, the analysts
and pundits would be all over the "breakout" ---blah, blah, blah.
Figure 1. Price Chart/ weekly
But figure 1 isn't a stock, it is the yield on the 30 year Treasury, and the chart has
been turned upside down. What I hear and read is this move in Treasury bonds isn't
sustainable. A sub 3% yield isn't possible, but isn't that what "they" said about a sub 4%
yield? Which happens to be in the rear view mirror.
been turned upside down. What I hear and read is this move in Treasury bonds isn't
sustainable. A sub 3% yield isn't possible, but isn't that what "they" said about a sub 4%
yield? Which happens to be in the rear view mirror.
People still don't believe, and they are not interpreting the significance of the price
action correctly. Maybe if this were a stock people would be wowed by the price
action. But they aren't. For the record, figure 2 is a weekly chart of the yield on the
30 year Treasury bond (symbol: $TYX.X). Are the low yields of late 2008 the next
stop?
If This Were A Stock....
_______________________________________
Check it out on The MasterCharts
Thursday, August 19, 2010
Bankruptcies: Going for broke | The Economist
Bankruptcies: Going for broke | The Economist: "Bankruptcies rise in America
Aug 18th 2010
BANKRUPTCY filings rose 20% in the year to June 30th compared with the previous 12-month period, according to statistics released on August 17th by the Administrative Office of the US Courts. This takes quarterly filings to their highest point since tougher bankruptcy laws were introduced at the end of 2005. That change brought a spike of bankruptcies, as companies and individuals rushed to declare themselves broke under the more lenient old regime. The data suggest that an older trend is reasserting itself. This is could be more bad news for America—or it could just mean that creative destruction is alive and well."
________________________
Subscribe to:
Posts (Atom)