MasterSearch

Showing posts with label crash. Show all posts

Thursday, March 17, 2011

The Day The Yen Carry Trade Died | zero hedge

The Day The Yen Carry Trade Died | zero hedge


It's gotta hurt real bad now!!!


While everyone is staring in disbelief at the USDJPY, the real carry action is in the high yielding-YEN pairs, i.e., the development, high growing countries. And it's a massacre: ZARJPY, NZDJPY, AUDJPY - all are plunging far more than the USD. This is nothing short of a complete carry trade unwind. The implications: the cheapest recurring source of funding for risk assets - the Yen carry trade, is over. Those who managed to sell early on are lucky. The rest will get such an onslaught of margin calls tomorrow they may need to access the discount window (if Primary Dealers and the luckier banks). Many will be forced to sell assets to satisfy collateral requirements as ongoing sales of carry pairs push the Yen ever higher, and force ever more liquidity out of the market. And if the Yen carry trade is done, the question is when will the USD, which has also been a carry currency for some time, follow suit. And, once again, the most troubling observation is that the BOJ has not intervened. Our sinking feeling is that after pumping 50 trillion or so in money markets, the petty cash may be running quite low. In any case, ES opens in 2 minutes. Grab the popcorn now.


The Day The Yen Carry Trade Died | zero hedge

Share
_______________________________________
Check it out on The MasterCharts

Friday, February 18, 2011

Banks and investment firms have rebounded fastest since March 2009 lows

Chart of the day: Barclays and Lloyds soar since lows

Kit Chellel
18 Feb 2011
4068036725_c300,200,50,50,100.gif

How financial firms in the FTSE100 have performed since the lowest point of the crisis
Two weeks from today is the second anniversary of one of the darkest moments of the financial crisis, when the FTSE 100 fell to a new low and Barclays shares were going for as little as 81p.
On that day, March 3, 2009, the 100 largest companies in the UK were worth less than they were when Tony Blair was elected in 1997.
The FTSE 100 has not hit such depths since, and an equities rally over the past few months has seen the index recover to somewhere near two-year highs.
Figures compiled by Financial News show that banks and investment firms have rebounded fastest, albeit from a lower level.
An investor who bought shares in the 10 financial firms (excluding insurers) currently in the FTSE 100 back in March 2009, would have seen a return of 149% in those two years, based on prices on Thursday morning.
This compares to an average of 73% across the FTSE 100 index.
An investor who backed Barclays would have done even better. The bank, which avoided a government bailout by tapping up Middle Eastern oil money, has risen a staggering 311% in the same period.
Lloyds is up 205% and private equity group 3i 182%.
The worst performer was investment group Alliance Trust whose shares rose 58.8%, which is below the FTSE average.
Second from bottom among the financial firms was Man Group which has been beset by problems since the crash. The listed hedge fund has seen half its assets under management pulled out by investors since the start of the crisis. Despite this, its shares have still gained 92 per cent between March 2008 and now.
The share gains achieved by banks are all the more impressive given that Barclays, HSBC, Lloyds and RBS all carried out multi-billion pound share issues to recapitalise following the crisis, diluting the value of stock.
The FTSE 100 index closed at 6087.38 yesterday, helped by strong performance from Lloyds TSB (up 2.9%) and RBS (up 3.8%). However the index remains some way below the pre-crisis peak of 6721.60 on September 31, 2007.


http://www.efinancialnews.com/story/2011-02-18/barclays-and-lloyd-best-performing-shares-since-crisis-trough?utm_source=twitterfeed&utm_medium=twitter

Thursday, November 25, 2010

infographic: bailout mechanisms in Europe


As for those who still may be confused by how the various bailout mechanisms in Europe operate, we present to you this useful infographic by the Guardian.


http://the-masterblog.blogspot.com/2010/11/its-official-there-is-not-enough-money.html


Share this|
________________________

Wednesday, September 01, 2010

Demonised ‘algos’ push the surge in FX trading - FT.com

Oh, poor "Demonized Algos" !!!

Demonised ‘algos’ push the surge in FX trading

By Jennifer Hughes, Senior Markets Correspondent
Published: September 1 2010 00:04 | Last updated: September 1 2010 00:04
Since the infamous stock market “flash crash” of May 6, high-frequency, or algorithmic, trading has been unwillingly dragged into the political and regulatory limelight.
forex-trading-graphicSo far, however, attention has focused on the role of these high-speed traders in the equity market. Outside the glare of that publicity, it is less well known that on May 7, FX trading volumes reached records, straining the plumbing of these markets.
Some participants argue these strains were partially caused by algorithmic, or algo, traders.
Exactly how much of this can be attributed to algo trading is unclear. However, there is no question that high-frequency traders are a fast-increasing force in FX markets, which is sparking a fierce debate as to their value to the market.
On Tuesday, the Bank for International Settlements reported that average daily turnover in the FX market has jumped 20 per cent in the past three years to $4,000bn a day. Its survey was taken in April, so missed the May spike, which related to the eurozone sovereign debt crisis.
The BIS-reported gains were led by a near 50 per cent leap in spot trading – deals for immediate delivery – to $1,500bn a day. This jump was powered by increased activity from “other financial institutions”, a group that includes hedge funds, pension funds, some banks, mutual funds, insurance companies and central banks. This will also include algos.
While all categories of “other” could have increased their trading, it is likely a significant proportion was driven by algo traders, who favour the deep, liquid spot markets and particularly currency pairs such as eurodollar and dollar-yen, which between them account for 42 per cent of all currency trading.
The question for the FX market is whether high-frequency dealers improve the market by adding liquidity, or whether they are instead merely price takers who contribute little.
“Algos have been demonised, but they’re an important part of the growth story,” says David Rutter chief executive of Icap Electronic Broking, which runs EBS, the main FX interbank trading platform. “What we’ve found is that they add pressure at each price point so that instead of getting big price gaps on shocking news, trade is more orderly.
“With FX, there are a lot of other flows such as global trade, so there is good underlying liquidity that the algos can enhance.”
Algos initially appeared in FX markets almost a decade ago, attracted by the deep liquidity and increasing use of electronic trading. They were generally welcomed, particularly by banks looking to build their prime brokerage businesses. However many banks soon grew disenchanted when they found the fast-moving shops were profiting from banks’ own slow systems by exploiting brief, tiny price differences between rival platforms.
Some banks went as far as ejecting offenders from their platforms but banks’ views have since become more nuanced. They have generally reached an accommodation, helped by technological improvements which make it easier to monitor client dealings and offer client-specific prices.
“The facts are that algos have made the markets more efficient and have helped ensure there’s one virtual price,” says Jeff Feig, global head of G10 FX at Citigroup. “They do cause banks to be smarter and we’ve had to work harder to be more efficient, but that’s ultimately to the advantage of the end user.
“I think that to some extent, algos have pushed banks and the result has been enhanced transparency and increased liquidity.”
Algos mean many different things in the FX market. While high-frequency traders are the best known – typified by one senior banker as “five smart guys in a room in New Jersey,” – banks are increasingly adept at developing their own algorithms to make their internal FX deals more efficient. These “internalisation” trades too will have provided a boost to the BIS numbers.
Most players say algos are now a fact of life in currency markets.
Unlike the equity market, which is split into hundreds of stocks, they believe the FX world’s focus on a relatively small number of currency pairs means it would be far harder for a single group of participants to move the market significantly, intentionally or otherwise, as some watchers fear happened during the “flash crash”.
“Also trading can happen anywhere there’s an electronic execution system and a volatile market,” says Alan Bozian a former FX banker and now chief executive of CLS Bank, the FX settlement system. “The question is, which markets adapt well and I don’t think it’s necessarily the stock market.”
FX markets have proved generally good at adapting. Systems such as CLS, introduced years before the financial crisis, have helped minimise settlement risk and since May, participants have been working again to improve their processing systems to cope with increased volume.
Significantly, for a market that is very much built around a hub of big banks, the BIS report showed that, for the first time, interaction of the main banks with “other” financial institutions overtook trading between themselves.
This could be a pointer to the market of the future, where banks are likely to remain the hub, but as much for their trade processing abilities as for their liquidity.
This would allow the winners to build profitable volume without taking on huge trading risks – suiting the current regulatory mood.
“The banks want to continue being the price providers, but they’re getting much more interested in the infrastructure and improving that,” says Mr Bozian. This evolution is likely to apply to high-frequency trading too.
Mr Rutter believes algos are only in their “late teens” in terms of development. “The early algo trading was about super-fast dealing and chasing inefficiencies. That’s largely gone,” he says.
“Now its about math and science being thrown at the market – there’s a rich pool of data and I think we’ll see algos evolve so its not just about milliseconds, but about longer-term predictive math.”
"FT" and "Financial Times" are trademarks of the Financial Times. Privacy policy | Terms


FT.com / Currencies - Demonised ‘algos’ push the surge in FX trading

Share
-- The MasterFeeds

Wednesday, August 25, 2010

Richard Russell's Daily Letter

August 24, 2010 - "I place economy among the first and most important virtues and public debt as the great danger to be feared. To preserve our independence, we must not let our leaders load us with perpetual debt. We must make our choice between economy and liberty, or profusion and servitude." Thomas Jefferson. 
...................................................................................


Throw a tennis ball up in the air, and it will lose upward momentum as it rises. At some point upside momentum will completely fade, and the ball will stand still in mid-air. After standing still for a brief moment, the ball will head back toward earth.


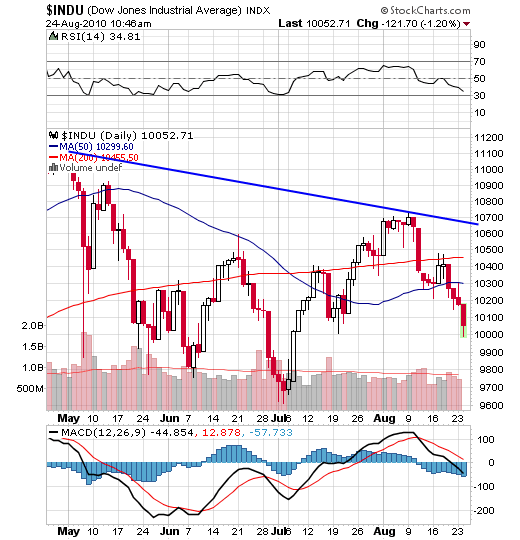
Somehow, I get the same feeling about the stock market. The market gained initial upside momentum as it surged up from its July low. By early August the market had lost upward momentum. For seven days the Dow moved sideways as if suspended in midair. On August 11, the market suddenly plunged 265 Dow points, and in so doing it fell out of its sideway trading range. From there, the Dow whipped back and forth, and by August 19, the Dow had fallen bearishly below both its 59-day and 200-day moving averages.


The daily chart below shows us what the Dow looks like now. Note that RSI is heading down, and MACD has turned negative. At the same time, the Dow is situated below its 50-day moving average, and the 50-day MA, in turn, is below its (red) 200-day MA. Finally, note that the Dow has assumed the form of a head-and-shoulders top that has now broken down. In all, a classic set of bearish relationships. 


I'm including a P&F chart of the Dow below. Note the latest red column of X's which just plunged below the 10150 box and below the rising blue trendline. According to this P&F chart, we received a "sell signal" this morning when the Dow broke below the preceding column of 0s and below it rising blue trendline. The P&F "projection" is that this break should take the Dow down to the 9750 box.


Incidentally, there is no shortage of "distribution days." The latest score for the last two weeks is -- 6 for the S&P 500, 5 for the Dow, 5 for the NASDAQ and 5 for the NYSE Composite. That's far too many, and it implies heavy institutional selling.
Yesterday, I wrote about the Treasury bonds. Every "smart" trader and investor has rushed into Treasury bonds as the ultimate save-haven area. I believe Treasury bonds and high-grade corporate bonds are in a bubble. There are just too many believers in bonds as the ultimate safe place to be. 


When everybody piles onto one side of the ship, the ship lists. And just as quickly, everybody rushes to the other side of the ship. That's where I think we are with bonds. 


The weekly chart below follows the 30-year T-bond. RSI tells us that the bond is overbought. The full stochastics at the bottom of the chart confirms that the bond is overbought. And the blue histograms are slanting downwards towards zero. All in all, I don't like the looks of the bonds. Any hint of rising interest rates could send the bond market off the edge of the popularity cliff. 


Gold -- I took today's stock market sell-off as an indication that business will be rotten in the months ahead. Rotten business will put pressure on the Fed to print, print, print. Wide open quantitative easing will put pressure on the dollar, and this, in turn, will put UPWARD pressure on gold. And gold may have started to discount that situation today.


Share |
_______________________________________
Check it out on The MasterCharts

Wednesday, August 11, 2010

Is Gold Crash Proof This Time Around? | zero hedge

Is Gold Crash Proof This Time Around?

I’ve been receiving quite a few emails regarding the topic of Gold and how it will perform if another Crash hits. The following are my thoughts on this matter.

The first thing that needs to be said is that IF we have another systemic meltdown like that of Autumn 2008, Gold will likely go down along with everything else. There are simply too many big players (hedge funds, investment banks, etc) with heavy exposure to Gold who would be forced to liquidate their positions during a systemic collapse.

I know this is not what the Gold bugs want to hear, but during systemic Crises, just about every investment on the planet plunges while the US Dollar and Treasuries rally. Of course, this time around if another 2008-type event hits, it will undoubtedly involve or be focused on sovereign debt. So this raises the potential that Treasuries, particularly those on the long-end of the yield curve, could be hammered as well as all other assets outside the Dollar. This is worth keeping in mind for those who view Treasuries as a safe haven.

So if we go into a 2008-type event, Gold will fall. It will likely fall much less than other assets (stocks and industrial commodities), but it will still go down at least at first. This forecast is confirmed by the market action in 2008 as well as the market collapse from April 2010-July 2010. Both times Gold took a hit, but both times it came back quickly.

So if you’re heavily exposed to Gold, you’re going to need to think “big picture” or have a very strong stomach when the market Crashes.

Now, let’s take a look at the charts.

For starters, the number one metric you need to focus on in terms of determining Gold’s market action is the 34-week exponential moving average. Since the Gold bull market began in 2001, this has been THE support line for Gold.

As you can see, Gold has only broken below this line ONCE in the last ten years and that was during the 2008 systemic collapse. So take a note of this line and always watch where Gold trades relative to it.

Indeed, a significant break below this line that DOESN’T occur during a system Crash would be a MAJOR warning that the Gold bull market is in trouble. Remember, the ONLY time we took this line out before was during the systemic collapse in 2008. So a break below it WITHOUT a Crisis would be VERY bearish.

And if Gold breaks below this line on its own (without a Crisis) and then fails to reclaim it… well, then it would be SERIOUS time to reevaluate the Gold bull market story.

Because of its significance as THE support line for the Gold bull market, the 34-week exponential moving average also serves as an excellent gauge for determining when Gold needs to take a breather or correct.

Indeed, anytime Gold has stretched too far away from this line to the upside, it has usually staged a pretty sharp reversal to re-test this line. I’ve circled the most significant episodes of this from the last seven years in red on the chart below.

These are the BIG picture gauges and items to take note of: the points to remember in terms of determining where Gold is in its bull market and whether it’s an asset class you want to “buy and hold.”

Now let’s move into the more intermediate gauges and items relevant to determining Gold’s action from a trading perspective in the past and today.

Gold’s bull market of the last ten years has largely taken place within the confines of several very clear upward trading channels. Indeed, each “leg up” has featured Gold breaking above the upper trend-line of a given channel at which point said upper trend-line became the lower trend-line for the next trading channel (see below).

As you can see, the first “leg up” in Gold’s bull market took place from 2001 to late 2005. At that point Gold broke out of its old trading channel and entered its “next leg up” which took place from 2006-until early 2008 when the Bear Stearns crisis blasted Gold into yet another trading range.

The systemic Crash in Autumn 2008 brought Gold back down into a former range (the only time this happened in the last 10 years), but the precious metal bounced back quickly. It DID have some difficulty breaking into its final “leg up” and staying there this time around, but by mid-2009, Gold was again on a tear entering its highest trading range yet where it remains today.

You’ll note that the clear significance of these various trend lines have made for some great trading: virtually every test of a trend line to the upside or downside made for a good exit or entry point for a short-term trade.

As I write this, Gold is trading in a well-defined range between $1,150 and $1,300. Going by Gold’s action of the last 10 years, we could see the precious metal continue to trade in this range for a while without breaking out either way. This, of course, assumes we don’t have another systemic meltdown AND that the Gold bull market has plenty of more room to run.

The major indicators that could nullify this forecast are:

1) A break below the lower trend line WITHOUT a Crash

2) A break above the upper trend line that held

Regarding #1 [1], if Gold broke below its lower trend line without a systemic “episode,” it would represent the first time Gold broke to a lower trading range without systemic risk. That would be a MAJOR red flag to watch out for if you’re a Gold bull.

Conversely, a significant break above $1,300 would signal yet another “leg up” has begun and would a MAJOR sign that the Gold bull market has plenty of more room to run.

A final significant move to watch for would be if Gold were to collapse into a lower trading range as a result of a Crash and NOT break out again. Even during the 2008 disaster, Gold was back to re-testing its upper trend line within a few months. So if another systemic Crash hits and Gold doesn’t bounce back quickly that’s ALSO a major warning sign that the Gold bull market is in trouble.

We’ve covered a lot of ground here, so I’ll close this article by listing the main points of this article:

1) “buy and hold” Gold investors MUST focus on the 34-week exponential moving average (currently $1,158). A break below this level WITHOUT a Crash is BAD NEWS.

2) Traders should focus on Gold’s trend lines for determining entry and exit points. Currently the trend lines are $1,300 on the upside and $1,150 on the downside.

A break below $1,150 WITHOUT a Crash would be a MAJOR warning to the bulls. So would a break below $1,150 WITH a Crash that wasn’t quickly followed by a strong bounce back and re-test of the upper trend line.

Good Investing!

Graham Summers

PS. to get more in depth market analysis and find out about a proprietary "buy and hold" trading trigger that has caught both major "legs up" in Gold AND avoided the

2008 Crash, you can join me at www.gainspainscapital.com.


Is Gold Crash Proof This Time Around? | zero hedge

ShareThis

Gold or Silver?

MasterSearch