MasterSearch

Showing posts with label Forex. Show all posts

Thursday, March 05, 2020

#Dollar-#Euro has had a wild ride in the last month...


Share
_______________________________________
Check it out on The MasterCharts

Tuesday, July 30, 2013

#Infographic: Rise of the #Yen #FX Contracts | OpenMarkets


In terms of currencies, 2013 has been the year of the yen.  Japan’s Prime Minister Shinzo Abe took office in December 2012 with the promise to devalue the currency, and make the country more competitive in global trade. He’s delivered, and markets have followed with great interest, causing many to declare “currency wars” as other economies have raced to adjust the value of their currencies in response.
Abenomics, as it’s been called, has taken hold, and CME Group’s FX markets have responded, breaking several yen trading records, including the monthly average daily volume record in June. At the same time, we’ve seen that Fed officials have indicated that the end of QE is near, so long as the unemployment rate appears on a path toward 6.5 percent in 2014. Both central bank actions seem to have un-pegged the dollar and yen in recent months.
We created this infographic to trace the economic events this year with the growth in JPY/USD trading.

Infographic: Rise of the Yen FX Contracts | OpenMarkets


Friday, September 09, 2011

Global Currency Wars Sees Swiss Franc Devalue 8.5% Against Gold In Week | ZeroHedge

Gold in Swiss Francs

Gold in Swiss Francs – 5 Day (Tick)


Gold in Swiss Francs in Nominal Terms – 40 Years (Quarterly)
From zerohedge.com:
The Swiss franc’s 10% plummet against gold this week clearly shows how cash is far from ‘king’ and no fiat currency in the world, in any bank in the world can be considered a “safe haven”.
Gold is again becoming the sovereign of sovereigns and reasserting itself as the safe haven money and asset par excellence.
If the Swiss franc, long considered the safest fiat currency in the world, can devalue 10% in a week, then it can happen and likely will happen to other currencies as well.


Global Currency Wars Sees Swiss Franc Devalue 8.5% Against Gold In Week | ZeroHedge


Share
_______________________________________
Check it out on The MasterCharts

Switzerland's central bank EIU ViewsWire


see the whole article here and here:Switzerland's central bank EIU ViewsWire

Share
-- The MasterFeeds

Saturday, May 14, 2011

GBP/USD Technical Analysis

Cable Technical Analysis
gbpusd-technical-analysis

GBP/USD Technical Analysis

Recovery in the Pound today sees the pair back above 1.6266. Visible topping on the daily chart combined with the pairs inability to post a close above 1.6400 keeps the outlook bearish. Watch for a further run at 1.6426 high.

1.6222 provides initial support, with a break of 1.6140 targeting 1.5935.
GBP/USD Technical Analysis

Wednesday, January 26, 2011

Richard Russell’s Dow Theory Letters Daily Remark On Gold And The Markets

From Richard Russell's Dow Theory Letters Daily Remark

January 25, 2011 -- "Imagine telling Charles Dow 100 years ago about the inclusion of Disney, McDonald's, Wal-Mart, Home Depot, Amex, BofA, & JP Morgan Chase representing American industry for his index of 'industrial' giants'. Dow might have asked, 'What do they produce?" Without realizing that he was reacting like the Austrian school of economics that holds that wealth must be produced: It can't be borrowed or printed." From Ian McAvity's remarkable publication, Deliberations on World Markets."
...........................................................................

Gold has risen a fantastic ten years in succession. Gold, of late, has been receiving a lot of interest and publicity and advertising. Gold is probably overdue for a correction in this ongoing bull market. Analysts are talking about "gold correcting down to 1200 or even 1000." However, I believe that the more important picture is that the gold bull market has much further to go on the upside.

I've been reading the
McClellan Market report for years. It's one of the better and more intelligent reports that I read. McClellan does a good deal of research on cycles, and I must say some of their cycle studies work out quite well.

McClellan has discovered that there's a
cycle low appears for gold roughly every 12.5 months. The cycle lows have run as follows: Jan 6, '06, Jan 8, '07, Jan 7, '08, Jan 5, '09, Jan. 4, '10, Dec. 31, '10. McClellan puts the next cycle bottom for gold at February 8, 2011. Which means that the cycle low for gold should arrive at any time between now and February 8, give or take a few weeks before or after that date.

Interestingly, the McClellan cycle bottom for gold is due to arrive amid a good deal of professional bearishness regarding gold ("gold overdue for a major correction"). Thus, many traders have traded out of their gold positions, just as we near the date for the McClellan cycle bottom.

Below, the red arrows mark the McClellan cycle lows.


The Russell view -- It's virtually impossible to successfully time in-and-out trades during an ongoing primary bull market. Usually what happens is that the trader has moved out of the market just as the bull trend resumes. Thus, the bull market does what it's supposed to do -- advance while leaving most traders and Johnny-come-latelies behind.

And now, the stock market. I've posted two daily charts below. The first shows the D-J Industrial Average surging to a new high for the advance.


The daily chart below shows the D-J Transportation Average not only failing to confirm the new high in the Industrial Average but breaking below its most recent ascending trendline. What does this mean? In Dow Theory terms, we have a glaring non-confirmation. Now, either the Transports will follow the Industrials to new recovery highs -- or the Industrial Average will follow the Transports to lower levels. Or, the stock market advance may now stall out and work sideways, remaining at a high level.


How serious is the current overall situation? Very little is crystal clear at this point. The reason I say that is because the
Lowry's statistics remain steadfastly bullish.

Here's the mystery:
Lowry's Buying Power Index, signifying investor demand, as recently as January 14, was at a new bull market high. Furthermore, Lowry's Selling Pressure, signifying the supply of stocks for sale, was very recently at its lowest level since August of 2005. Both of these indices suggest that the bull market in stocks is still in force, and that in due time the market should work higher.

This puts us, as investors, in an unusual predicament. What to do? I fall back on the thesis that "When you don't know what you're doing, don't do anything. Just sit tight." That's the advice I follow for myself, and that's the advice I give to my subscribers. In other words, "First, do no harm."

The fact is that we haven't done too badly over the last three years. We circumvented one of the worst stock market crashes (2007-2009) in post-war history, and we show great paper profits in holding gold over recent years. True, we never loaded up with the Dow (diamonds) following the 2009 low, but missing an advance is a far different matter than taking a loss. 


Tuesday, January 25, 2011

Gold's broken link with the euro

Gold's broken link with the euro

January 24 2011 8:55 PM GMT 
--
By James Mackintosh
--
What is odd is that gold has, roughly, been tracking the euro in reverse. As the euro strengthened, the yellow metal weakened. The pattern has held since mid-November

Read the full article at: http://www.ft.com/cms/s/0/dfbdbc74-27fa-11e0-8abc-00144feab49a.html


Sent from my iPad

Thursday, November 25, 2010

infographic: bailout mechanisms in Europe


As for those who still may be confused by how the various bailout mechanisms in Europe operate, we present to you this useful infographic by the Guardian.


http://the-masterblog.blogspot.com/2010/11/its-official-there-is-not-enough-money.html


Share this|
________________________

Friday, September 17, 2010

CNBC Market Blah, Blah ..Friday Look Ahead: Tech a Focus for Stocks Friday, as Gold Dazzles Investors

Friday Look Ahead: Tech a Focus for Stocks Friday, as Gold Dazzles Investors

Published: Thursday, 16 Sep 2010 | 9:10 PM E
By: Patti Domm
CNBC Executive Editor
Some good news from the tech sector could be a positive for stocks Friday.
Outside the New York Stock Exchange in lower Manhattan.
Photo: Oliver Quillia for CNBC.com
Outside the New York Stock Exchange in lower Manhattan.

Both Oracle and Research in Motion reported strong earnings after Thursday's bell. Separately, Texas Instruments boosted its $0.12 dividend by a penny and said it would buy back another $7.5 billion shares. All three stocks were higher in after-hours trading.
Stocks Friday morning could feel the effect of the quadruple expiration of futures and options. Traders expect the expiration to be low key at the open, and if anything, the impact should be slightly positive.
CPI, at 8:30 a.m., is expected to show a 0.3 percent increase in August consumer prices. Consumer sentiment is expected to improve slightly to a reading of 70, from 68.9 last month, but economists say the strong performance of the stock market this month could push that number a bit higher. August's sentiment reading was the second lowest of the year. Consumer sentiment is released at 9:55 a.m.
Stocks drifted on both sides of the unchanged mark Thursday. The Dow ended up 22 at 10,594, and the S&P 500 was off less than a half point at 1124.  The dollar weakened against the euro, and dollar/yen was barely changed after the Bank of Japan intervened to curb the yen's rise Wednesday.
"This intervention might have higher chances of succeeding, assuming we continue to see relatively acceptable U.S. economic data. That's the critical thing," said Boris Schlossberg of GFT Forex. "...as long as the idea of double dip keeps receding, Treasury yields should stabilize and go back up and that will be critical to dollar/yen."
On the other hand, if we see the 10-year yield move to 2.5 percent, or dip below 2.5 percent, I don't think any amount of money will stem the (dollar) decline," he said.
Barry Knapp, chief equities portfolio strategist at Barclay's, said the initial stock market reaction after a big intervention is often a short-term decline. "For the first couple of days, the market goes down a little bit..the first reaction is to look at the dollar," he said.
The view is "if the dollar is going up, that's bad for earnings, so sell it. Dollar's going down, that's good. That's a very simplistic approach. I don't think it's right at all," he said. "If you look back at 2003, when the Japanese were intervening dramatically, the initial reaction was that the stock market sold off, and then it regained its footing."
Knapp said the intervention at that time was about $360 billion, and he estimated this round could total $250 billion. The BOJ was reported to have bought more than $20 billion Wednesday.
"If somebody puts $250 billion into the markets, event though that money won't be buying riskier assets, it can trigger an effect," he said.
The impact on Treasurys could also be noticeable, he said. Traders have been speculating the Japanese will park their dollar holdings in shorter duration Treasurys. "Initially the Treasury curve steepens, but then that tends to drive investors who were in 2s and 5s to extend out the curve and it starts to flatten. Then it triggers a whole position rebalancing."
All that Glitters
Gold continued to dazzle investors Thursday, scoring its second record settlement of the week. Investors are betting it could try to break the $1,300 level, maybe even as early as next week depending on the outcome of the Fed's meeting Tuesday.  Gold Thursday rose about a half percent to settle at $1273.80.
Gold has faced some high-profile criticism this week, including from investor George Soros who called it a bubble. "If you think about a world where every major country is trying to find a way to devalue its currency, gold looks pretty good in that environment. Personally I think the dollar is going down more. There's lots of reasons why gold will continue to rise. I don't know if I'd buy it, but I know I wouldn't short it," Knapp said.
 http://www.cnbc.com/id/39223276

Wednesday, September 01, 2010

Demonised ‘algos’ push the surge in FX trading - FT.com

Oh, poor "Demonized Algos" !!!

Demonised ‘algos’ push the surge in FX trading

By Jennifer Hughes, Senior Markets Correspondent
Published: September 1 2010 00:04 | Last updated: September 1 2010 00:04
Since the infamous stock market “flash crash” of May 6, high-frequency, or algorithmic, trading has been unwillingly dragged into the political and regulatory limelight.
forex-trading-graphicSo far, however, attention has focused on the role of these high-speed traders in the equity market. Outside the glare of that publicity, it is less well known that on May 7, FX trading volumes reached records, straining the plumbing of these markets.
Some participants argue these strains were partially caused by algorithmic, or algo, traders.
Exactly how much of this can be attributed to algo trading is unclear. However, there is no question that high-frequency traders are a fast-increasing force in FX markets, which is sparking a fierce debate as to their value to the market.
On Tuesday, the Bank for International Settlements reported that average daily turnover in the FX market has jumped 20 per cent in the past three years to $4,000bn a day. Its survey was taken in April, so missed the May spike, which related to the eurozone sovereign debt crisis.
The BIS-reported gains were led by a near 50 per cent leap in spot trading – deals for immediate delivery – to $1,500bn a day. This jump was powered by increased activity from “other financial institutions”, a group that includes hedge funds, pension funds, some banks, mutual funds, insurance companies and central banks. This will also include algos.
While all categories of “other” could have increased their trading, it is likely a significant proportion was driven by algo traders, who favour the deep, liquid spot markets and particularly currency pairs such as eurodollar and dollar-yen, which between them account for 42 per cent of all currency trading.
The question for the FX market is whether high-frequency dealers improve the market by adding liquidity, or whether they are instead merely price takers who contribute little.
“Algos have been demonised, but they’re an important part of the growth story,” says David Rutter chief executive of Icap Electronic Broking, which runs EBS, the main FX interbank trading platform. “What we’ve found is that they add pressure at each price point so that instead of getting big price gaps on shocking news, trade is more orderly.
“With FX, there are a lot of other flows such as global trade, so there is good underlying liquidity that the algos can enhance.”
Algos initially appeared in FX markets almost a decade ago, attracted by the deep liquidity and increasing use of electronic trading. They were generally welcomed, particularly by banks looking to build their prime brokerage businesses. However many banks soon grew disenchanted when they found the fast-moving shops were profiting from banks’ own slow systems by exploiting brief, tiny price differences between rival platforms.
Some banks went as far as ejecting offenders from their platforms but banks’ views have since become more nuanced. They have generally reached an accommodation, helped by technological improvements which make it easier to monitor client dealings and offer client-specific prices.
“The facts are that algos have made the markets more efficient and have helped ensure there’s one virtual price,” says Jeff Feig, global head of G10 FX at Citigroup. “They do cause banks to be smarter and we’ve had to work harder to be more efficient, but that’s ultimately to the advantage of the end user.
“I think that to some extent, algos have pushed banks and the result has been enhanced transparency and increased liquidity.”
Algos mean many different things in the FX market. While high-frequency traders are the best known – typified by one senior banker as “five smart guys in a room in New Jersey,” – banks are increasingly adept at developing their own algorithms to make their internal FX deals more efficient. These “internalisation” trades too will have provided a boost to the BIS numbers.
Most players say algos are now a fact of life in currency markets.
Unlike the equity market, which is split into hundreds of stocks, they believe the FX world’s focus on a relatively small number of currency pairs means it would be far harder for a single group of participants to move the market significantly, intentionally or otherwise, as some watchers fear happened during the “flash crash”.
“Also trading can happen anywhere there’s an electronic execution system and a volatile market,” says Alan Bozian a former FX banker and now chief executive of CLS Bank, the FX settlement system. “The question is, which markets adapt well and I don’t think it’s necessarily the stock market.”
FX markets have proved generally good at adapting. Systems such as CLS, introduced years before the financial crisis, have helped minimise settlement risk and since May, participants have been working again to improve their processing systems to cope with increased volume.
Significantly, for a market that is very much built around a hub of big banks, the BIS report showed that, for the first time, interaction of the main banks with “other” financial institutions overtook trading between themselves.
This could be a pointer to the market of the future, where banks are likely to remain the hub, but as much for their trade processing abilities as for their liquidity.
This would allow the winners to build profitable volume without taking on huge trading risks – suiting the current regulatory mood.
“The banks want to continue being the price providers, but they’re getting much more interested in the infrastructure and improving that,” says Mr Bozian. This evolution is likely to apply to high-frequency trading too.
Mr Rutter believes algos are only in their “late teens” in terms of development. “The early algo trading was about super-fast dealing and chasing inefficiencies. That’s largely gone,” he says.
“Now its about math and science being thrown at the market – there’s a rich pool of data and I think we’ll see algos evolve so its not just about milliseconds, but about longer-term predictive math.”
"FT" and "Financial Times" are trademarks of the Financial Times. Privacy policy | Terms


FT.com / Currencies - Demonised ‘algos’ push the surge in FX trading

Share
-- The MasterFeeds

Wednesday, August 25, 2010

Richard Russell's Daily Letter

August 24, 2010 - "I place economy among the first and most important virtues and public debt as the great danger to be feared. To preserve our independence, we must not let our leaders load us with perpetual debt. We must make our choice between economy and liberty, or profusion and servitude." Thomas Jefferson. 
...................................................................................


Throw a tennis ball up in the air, and it will lose upward momentum as it rises. At some point upside momentum will completely fade, and the ball will stand still in mid-air. After standing still for a brief moment, the ball will head back toward earth.


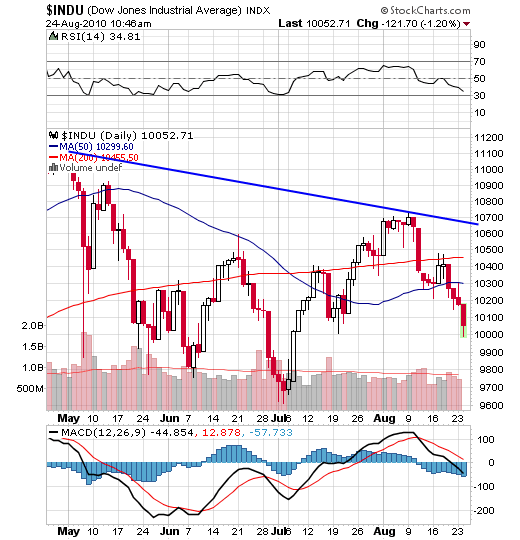
Somehow, I get the same feeling about the stock market. The market gained initial upside momentum as it surged up from its July low. By early August the market had lost upward momentum. For seven days the Dow moved sideways as if suspended in midair. On August 11, the market suddenly plunged 265 Dow points, and in so doing it fell out of its sideway trading range. From there, the Dow whipped back and forth, and by August 19, the Dow had fallen bearishly below both its 59-day and 200-day moving averages.


The daily chart below shows us what the Dow looks like now. Note that RSI is heading down, and MACD has turned negative. At the same time, the Dow is situated below its 50-day moving average, and the 50-day MA, in turn, is below its (red) 200-day MA. Finally, note that the Dow has assumed the form of a head-and-shoulders top that has now broken down. In all, a classic set of bearish relationships. 


I'm including a P&F chart of the Dow below. Note the latest red column of X's which just plunged below the 10150 box and below the rising blue trendline. According to this P&F chart, we received a "sell signal" this morning when the Dow broke below the preceding column of 0s and below it rising blue trendline. The P&F "projection" is that this break should take the Dow down to the 9750 box.


Incidentally, there is no shortage of "distribution days." The latest score for the last two weeks is -- 6 for the S&P 500, 5 for the Dow, 5 for the NASDAQ and 5 for the NYSE Composite. That's far too many, and it implies heavy institutional selling.
Yesterday, I wrote about the Treasury bonds. Every "smart" trader and investor has rushed into Treasury bonds as the ultimate save-haven area. I believe Treasury bonds and high-grade corporate bonds are in a bubble. There are just too many believers in bonds as the ultimate safe place to be. 


When everybody piles onto one side of the ship, the ship lists. And just as quickly, everybody rushes to the other side of the ship. That's where I think we are with bonds. 


The weekly chart below follows the 30-year T-bond. RSI tells us that the bond is overbought. The full stochastics at the bottom of the chart confirms that the bond is overbought. And the blue histograms are slanting downwards towards zero. All in all, I don't like the looks of the bonds. Any hint of rising interest rates could send the bond market off the edge of the popularity cliff. 


Gold -- I took today's stock market sell-off as an indication that business will be rotten in the months ahead. Rotten business will put pressure on the Fed to print, print, print. Wide open quantitative easing will put pressure on the dollar, and this, in turn, will put UPWARD pressure on gold. And gold may have started to discount that situation today.


Share |
_______________________________________
Check it out on The MasterCharts

Saturday, August 21, 2010

Gold: The Enemy of Currencies

Gold: The Enemy of Currencies
Last week saw gold prices rise despite deflationary fears.
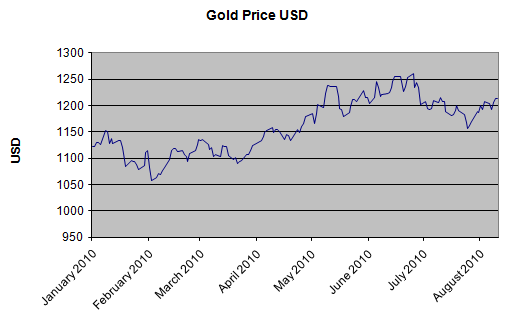
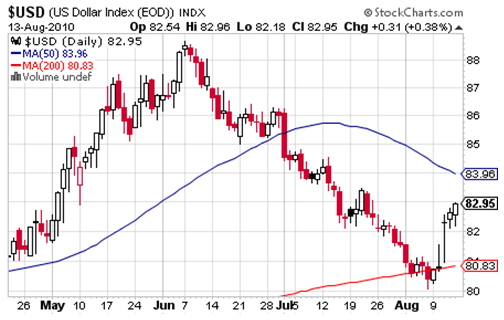
Taking a look at the chart below we can see the gold price in US dollars has traded in a narrow range since May. This is despite the dollar declining for much of that time, see chart further below. (Click to enlarge)
 

 We noted last week that we were going to keep an eye on the Fed Open Market Committee meeting in case they decided to increase the money supply even further. But they didn’t.

The Federal Open Market Committee failed to commit to anything... they didn’t say they would resort to more quantitative easing... they didn’t say they wouldn’t. Instead they’re pausing for breath.

The inflation, deflation debate continues 
As the deflationary, inflationary debate continues to be waged between financial heavyweights we stand on the side and watch. We’ve always believed the act of quantitative easing is inflationary; It inflates the money supply. We also think the governments only way out, of this huge debt burden it has imposed upon itself, is to inflate the debt. If you make the value of your debt less you have less to pay back, but it’s a juggling act. Inflate too much and you run the risk of hyperinflation, something that, the Germans will tell you, doesn’t bode well for an economy.

US Trade Deficit
What’s the next move for gold? We have to wait and see what happens around the globe to find that out. Certainly, its course is no longer dictated by the movement of the dollar as much as it once was. Will this relationship resurface? Probably, but when it does it will most likely be when the dollar makes a significant move, triggering panic in the dollar or gold.

Which is more likely – a panic or strength in the dollar?
Last week Bloomberg reported that the US trade deficit has swelled to an incredible figure:
“The U.S. trade deficit widened by $7.9 billion in June, the most since record-keeping began in 1992, to $49.9 billion, a report from the Commerce Department showed. Exports posted the biggest decline since April 2009.

“Investors should prepare for “major structural changes” as the global economy shifts to slower growth, Mohamed A. El- Erian, chief executive officer at Pacific Investment Management Co. said yesterday in a radio interview on “Bloomberg Surveillance” with Tom Keene.”

This news reverberated around the markets.

A quick look at the VIX index shows us that fear has reentered the market... again. At the far right of the graph you can see the index rises sharply which signifies a growing fear of volatility in the markets.


With a stuttering economy and growing tension between the US and China, the trade balance could play a huge role in a dollar devaluation. But in order for the dollar to drop further people will have to lose faith in its safe haven status. Which means an alternative currency will need to take its place. The problem with this scenario is that there aren’t too many other candidates for the role as a global reserve currency. And whilst that is the case gold can continue to take center stage.

Will things get better?
In the grand scheme of things the debt, from Dubai to Greece has just been shuffled around. The run up in the stock markets suggests stability but investors are cautious. They’re wondering if this is another ‘suckers rally’. And they’re right to be cautious. If you play with fire... well you know that old saying. In other words it doesn’t end well.
Can things get better? That depends on what governments do.

More money printing can only add to the attractiveness of gold. But gold is the enemy of currencies. As Alan Greenspan once noted, to control the dollar you have to control the gold price.

The fight for governments around the world is one which is traded in blows against the gold price. And should they win the price of gold may very well settle back to lower prices until supported by a strong level of jewelry demand. But this is dependent on currencies being kept under control. Both the US and the UK have not ruled out further money printing, and with each new wave of money the original currency is worth less and less.

It all sounds too reactionary to us. There doesn’t seem to be a grand plan. Maybe there cannot be as the markets lead themselves. But whatever the case, none of the actions by those in power have any finiteness about them. There’s no plan and no control.

Disclosure: No positions
http://seekingalpha.com/article/221174-gold-the-enemy-of-currencies?source=feed
Share |
_______________________________________
Check it out on The MasterCharts

Friday, August 20, 2010

A Brief History of the Dollar

A Brief History of the Dollar

Calafia Beach Pundit submits:


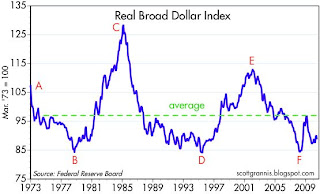
Here, in a nutshell, is my version of the history of the dollar's history, with a focus on its major turning points. As a point of reference, I'm using the Fed's Real Broad Dollar Index (chart above), which measures the dollar's value against a large basket of trade-weighted currencies, all adjusted for changes in relative inflation. It's arguably the best measure of the dollar's true value against other currencies. I've marked 6 key turning points in the dollar, and I explain here the key events occurring around the time of each turning point. I also opine on the future of the dollar.

A: Most measures of the dollar's value only go back to 1973. That's unfortunate, since the modern history of the dollar begins in August 1971, when Nixon ended the dollar's convertibility into gold. Prior to that point, the dollar had been fixed to gold at $35/oz. since 1934, and most of the world's currencies were pegged in some fashion to the dollar. Nixon's decision to abandon the gold standard was the catalyst for what would eventually prove to be a major devaluation of the dollar. The underlying cause of the dollar's collapse, however, was the Fed's decision to ease monetary policy in support of Great Society spending programs. The Fed's easy money policy started in the mid-1960s, and it was reflected in a steadily increasing outflow of gold. The Fed was holding interest rates at artificially low levels, and this was undermining the world's confidence in the dollar. Central banks began demanding gold in exchange for their dollar holdings, until Nixon's decision put an end to that. That decision effectively relieved the Fed of the need to raise interest rates significantly, which in turn exposed the fact that there was a huge excess supply of dollars in the world.

Complete Story

A Brief History of the Dollar

https://blogger.googleusercontent.com/img/b/R29vZ2xl/AVvXsEjYxDjFUf_c6oeNNdKQnrdRle3D82T8VYtKBHFbcb_Yv6DCCh2MwtMQ1jvqRiaDMzwYLrFSFdbto-_pwdfW7WZNH2JrYy7gWSVk6p6hkCy9EBmBgCTAMKUgSIFDBRfnZF8y5MsWtw3NNsU/s1600/Real+Broad+Dollar+Index

-- The MasterFeeds

Thursday, August 12, 2010

U.S.-China Trade Gap Stirs Lawmakers - WSJ.com


U.S. Lawmakers Gear Up to Seek New Yuan Policy

WASHINGTON—The U.S. trade deficit with China in June hit its highest level in nearly two years and could spur congressional pressure on Beijing to revamp its currency policy.

America's trade deficit with China jumped 17% in June over the previous month to $26.2 billion, the biggest gap since October 2008. Earlier this week, China said its overall trade surplus hit $28.7 billion in July, an 18-month high.
Associated Press
A production line in Guangdong province, in southern China, in May.

The Commerce Department figures could set the stage for a fight in Congress this fall over China's currency policy. Some lawmakers, arguing that China has set the yuan artificially low to make its exports more price competitive on global markets, are keen to pass laws that would penalize countries that are found to be manipulating their currencies.

China, under pressure from the U.S. and other countries, announced a shift to a more-flexible exchange rate in June. But the yuan has appreciated less than 1% since then, and some economists say that it remains undervalued against the dollar by at least 25%.

While efforts to pass such legislation have made little headway, lawmakers and industry groups agree that the issue could gain traction in September, given that voters, who head to the polls in November, are angry about the country's continued weak economy and high unemployment rate.

A number of bills have garnered bipartisan support, including measures promoted by Tim Ryan (D., Ohio) and Patrick Murphy (D., Pa.) in the House, and by Charles Schumer (D., N.Y.) in the Senate.

These efforts would, among other things, make it easier for companies to seek import duties on goods from countries designated as having undervalued currencies. The Ryan-Murphy bill has more than 127 co-sponsors, including 37 Republicans.

Nadeam Elshami, a spokesman for House Speaker Nancy Pelosi (D., Calif.), said the House Ways and Means Committee would hold a hearing on the currency issue in September after Congress returns from summer recess.

"But no final decisions have been made on moving legislation forward," he said.

Sen. Sherrod Brown (D., Ohio), a co-sponsor of the Schumer bill and a member of President Barack Obama's Export Council, wrote Mr. Obama on Aug. 4, urging the administration to take tougher measures to address "unfairly subsidized exports" by countries such as China. Ten other senators signed the letter, including Republicans Jim Bunning of Kentucky and Olympia Snowe of Maine.

The Treasury Department on Wednesday declined to comment on the U.S.-China trade gap or China's currency policy.

Business groups are expected to intensify their lobbying on the issue, although they differ over whether punitive legislation aimed at China's currency policy is the best solution for narrowing the U.S.-China trade gap.

Augustine Tantillo, executive director of the American Manufacturing Trade Action Coalition, a Washington trade group representing U.S. manufacturers, says the group backs the Ryan-Murphy bill and is lobbying lawmakers, targeting those from Midwestern and Southeastern states with large manufacturing sectors and high unemployment.

"These trade surpluses aren't a result of happenstance," he said. "We're hoping concerns about job creation and the fall election environment will finally give us an opportunity to bring the legislation to a vote."

Erin Ennis, vice president for the U.S.-China Business Council, which represents U.S. companies doing business in China, said the window for China to "show it was serious" about addressing U.S. concerns about the yuan would close in September, when Congress returns to session.

But while Ms. Ennis expected the Chinese currency policy to be a major issue in the fall, "this isn't our member companies' top priority," she said.

Rather, she said that Congress and the administration should focus on reducing barriers to China's market and on the country's new "indigenous innovation" policy, which many Western companies say unfairly favors Chinese companies by promoting domestic innovation.
Write to Kathy Chen at kathy.chen@wsj.com
U.S.-China Trade Gap Stirs Lawmakers - WSJ.com
_______________________________________
Check it out on The MasterCharts

Wednesday, August 11, 2010

Is Gold Crash Proof This Time Around? | zero hedge

Is Gold Crash Proof This Time Around?

I’ve been receiving quite a few emails regarding the topic of Gold and how it will perform if another Crash hits. The following are my thoughts on this matter.

The first thing that needs to be said is that IF we have another systemic meltdown like that of Autumn 2008, Gold will likely go down along with everything else. There are simply too many big players (hedge funds, investment banks, etc) with heavy exposure to Gold who would be forced to liquidate their positions during a systemic collapse.

I know this is not what the Gold bugs want to hear, but during systemic Crises, just about every investment on the planet plunges while the US Dollar and Treasuries rally. Of course, this time around if another 2008-type event hits, it will undoubtedly involve or be focused on sovereign debt. So this raises the potential that Treasuries, particularly those on the long-end of the yield curve, could be hammered as well as all other assets outside the Dollar. This is worth keeping in mind for those who view Treasuries as a safe haven.

So if we go into a 2008-type event, Gold will fall. It will likely fall much less than other assets (stocks and industrial commodities), but it will still go down at least at first. This forecast is confirmed by the market action in 2008 as well as the market collapse from April 2010-July 2010. Both times Gold took a hit, but both times it came back quickly.

So if you’re heavily exposed to Gold, you’re going to need to think “big picture” or have a very strong stomach when the market Crashes.

Now, let’s take a look at the charts.

For starters, the number one metric you need to focus on in terms of determining Gold’s market action is the 34-week exponential moving average. Since the Gold bull market began in 2001, this has been THE support line for Gold.

As you can see, Gold has only broken below this line ONCE in the last ten years and that was during the 2008 systemic collapse. So take a note of this line and always watch where Gold trades relative to it.

Indeed, a significant break below this line that DOESN’T occur during a system Crash would be a MAJOR warning that the Gold bull market is in trouble. Remember, the ONLY time we took this line out before was during the systemic collapse in 2008. So a break below it WITHOUT a Crisis would be VERY bearish.

And if Gold breaks below this line on its own (without a Crisis) and then fails to reclaim it… well, then it would be SERIOUS time to reevaluate the Gold bull market story.

Because of its significance as THE support line for the Gold bull market, the 34-week exponential moving average also serves as an excellent gauge for determining when Gold needs to take a breather or correct.

Indeed, anytime Gold has stretched too far away from this line to the upside, it has usually staged a pretty sharp reversal to re-test this line. I’ve circled the most significant episodes of this from the last seven years in red on the chart below.

These are the BIG picture gauges and items to take note of: the points to remember in terms of determining where Gold is in its bull market and whether it’s an asset class you want to “buy and hold.”

Now let’s move into the more intermediate gauges and items relevant to determining Gold’s action from a trading perspective in the past and today.

Gold’s bull market of the last ten years has largely taken place within the confines of several very clear upward trading channels. Indeed, each “leg up” has featured Gold breaking above the upper trend-line of a given channel at which point said upper trend-line became the lower trend-line for the next trading channel (see below).

As you can see, the first “leg up” in Gold’s bull market took place from 2001 to late 2005. At that point Gold broke out of its old trading channel and entered its “next leg up” which took place from 2006-until early 2008 when the Bear Stearns crisis blasted Gold into yet another trading range.

The systemic Crash in Autumn 2008 brought Gold back down into a former range (the only time this happened in the last 10 years), but the precious metal bounced back quickly. It DID have some difficulty breaking into its final “leg up” and staying there this time around, but by mid-2009, Gold was again on a tear entering its highest trading range yet where it remains today.

You’ll note that the clear significance of these various trend lines have made for some great trading: virtually every test of a trend line to the upside or downside made for a good exit or entry point for a short-term trade.

As I write this, Gold is trading in a well-defined range between $1,150 and $1,300. Going by Gold’s action of the last 10 years, we could see the precious metal continue to trade in this range for a while without breaking out either way. This, of course, assumes we don’t have another systemic meltdown AND that the Gold bull market has plenty of more room to run.

The major indicators that could nullify this forecast are:

1) A break below the lower trend line WITHOUT a Crash

2) A break above the upper trend line that held

Regarding #1 [1], if Gold broke below its lower trend line without a systemic “episode,” it would represent the first time Gold broke to a lower trading range without systemic risk. That would be a MAJOR red flag to watch out for if you’re a Gold bull.

Conversely, a significant break above $1,300 would signal yet another “leg up” has begun and would a MAJOR sign that the Gold bull market has plenty of more room to run.

A final significant move to watch for would be if Gold were to collapse into a lower trading range as a result of a Crash and NOT break out again. Even during the 2008 disaster, Gold was back to re-testing its upper trend line within a few months. So if another systemic Crash hits and Gold doesn’t bounce back quickly that’s ALSO a major warning sign that the Gold bull market is in trouble.

We’ve covered a lot of ground here, so I’ll close this article by listing the main points of this article:

1) “buy and hold” Gold investors MUST focus on the 34-week exponential moving average (currently $1,158). A break below this level WITHOUT a Crash is BAD NEWS.

2) Traders should focus on Gold’s trend lines for determining entry and exit points. Currently the trend lines are $1,300 on the upside and $1,150 on the downside.

A break below $1,150 WITHOUT a Crash would be a MAJOR warning to the bulls. So would a break below $1,150 WITH a Crash that wasn’t quickly followed by a strong bounce back and re-test of the upper trend line.

Good Investing!

Graham Summers

PS. to get more in depth market analysis and find out about a proprietary "buy and hold" trading trigger that has caught both major "legs up" in Gold AND avoided the

2008 Crash, you can join me at www.gainspainscapital.com.


Is Gold Crash Proof This Time Around? | zero hedge

Friday, July 23, 2010

Hypo Fails, All Other German, Portuguese, French Banks Pass Test

Tyler Durden
Subject: Hypo Fails, All Other German, Portuguese, French Banks Pass Test

And we uncover that the German Landesbanks (the equivalent of the bankrupt
Spanish cajas) did their own stress tests. Time for the PPT to step in with
this pretext and soak up all offers. Totally pathetic BS.
Update 1: Somehow Bank of Ireland "passes" the test but needs over €2
billion in extra equity... uhm... WTF??? This is the point where the
audience rushes the stage and burns the theater down.
Update 2: 5 Spanish cajas, 1 German and 1 Greek banks are eliminated on
their quest to marry the US taxpayer. 84 other banks will soon be the
recipients of far more US taxpayer generosity. And with that the season
finale of the farce comes to a close.
Description: http://feeds.feedburner.com/~r/zerohedge/feed/~4/f6DsejiAiBk

View article...
Hypo Fails, All Other German, Portuguese, French Banks Pass Test | zero hedge

Monday, June 28, 2010

Changing Central Bank attitudes: gold to be strongest asset class - GOLD ANALYSIS | Mineweb


Changing Central Bank attitudes: gold to be strongest asset class

Poll of Central Bankers suggests they expect gold to outperform equities, bonds, currencies - and oil. If they aren't selling gold it's probably a good job that no-one wants to borrow it either.
Author: Rhona O'Connell
Posted:  Friday , 25 Jun 2010 


LONDON - 
At its recent annual seminar for reserve management, investment bank UBS polled over 80 reserve managers from the official sector as to their views on different reserve assets.  One outcome was that gold was expected to be the strongest asset class in the second half of this year, while 22% of those polled thought that gold would be the most important reserve asset over the next 25 years.
This may seem like a long time horizon, but central bankers have to think in the long term as custodians of national wealth (expect, of course, when governments get in the way and insist on, for example, gold disposals with prior publicity).  The view underpins the swing in attitudes towards gold in the official sector that has been evolving.  Clearly the shifting tides in sentiment are informed by increased concern over fiscal imbalances, currency dislocations and sovereign risk, all of which have escalated over the past eighteen months, and which are therefore helping to change a trend of sales that was most-recently re-established in 1989.
Figures from Consolidated Gold Fields (as was) and GFMS Ltd, which assumed responsibility from Consolidated Gold Fields for compiling the Gold Survey when the former company was taken over by Hanson Trust (after a mighty tussle with Minorco) in 1989, show that over the 62 years 1948 to 12009 inclusive, the official sector has been a net seller for 34 years, or 55% of the time.  The sector was a net buyer from 1948 through to 1966, during which time it absorbed almost 8,000 tonnes.  Since then it has offloaded just over 10,000 tonnes, with world holdings, as reported to the IMF, standing at a shade below 30,200 tonnes.  The latest figures for world holdings, which relate to end-March, show a tonnage of 30,463t, reflect a 180t reclassification of Saudi's holdings, while much of the balance of the increase registered to "all countries", some 39 tonnes, comes from the acquisition programmes of Russia and the Philippines, plus, to a lesser extent, Venezuela. 
Annual and cumulative changes in the official sector's gold mountain (metric tonnes) - back to the post-world war II position?

CBGA signatories have, since the first Agreement was signed in September 1999, been responsible for 3,906 tonnes of the official sector's net disposals, equivalent to approximately 90% of the total. CBGA sales have collapsed this year with less than one tonne coming onto the market under CBGA3 so far this calendar year.  The majority of sales into the market since January have come from the IMF, which has sold almost 39t into the open market this year, leaving almost 153t to go. 
The implication from official statements from both the CBGA signatories and the IMF itself suggest that any further disposals into the open market (and it would look likely that the balance of the metal will come on-market unless a fresh central bank suddenly appears on the scene) will be worked, at least on a de facto basis, under the auspices of the CBGA.  Once this metal is out of the way then it s entirely possible that the official sector will become a net buyer of gold again for the first time since four years of purchases that amounted to over 630 tonnes (9% of mine supply) in 1985-1988. This was when producing countries were absorbing local production and others - notably Taiwan, amid much publicity, were - wait for it -diversifying away from the dollar....


http://www.mineweb.com/mineweb/view/mineweb/en/page33?oid=106888&sn=Detail&pid=102055

Monday, November 09, 2009

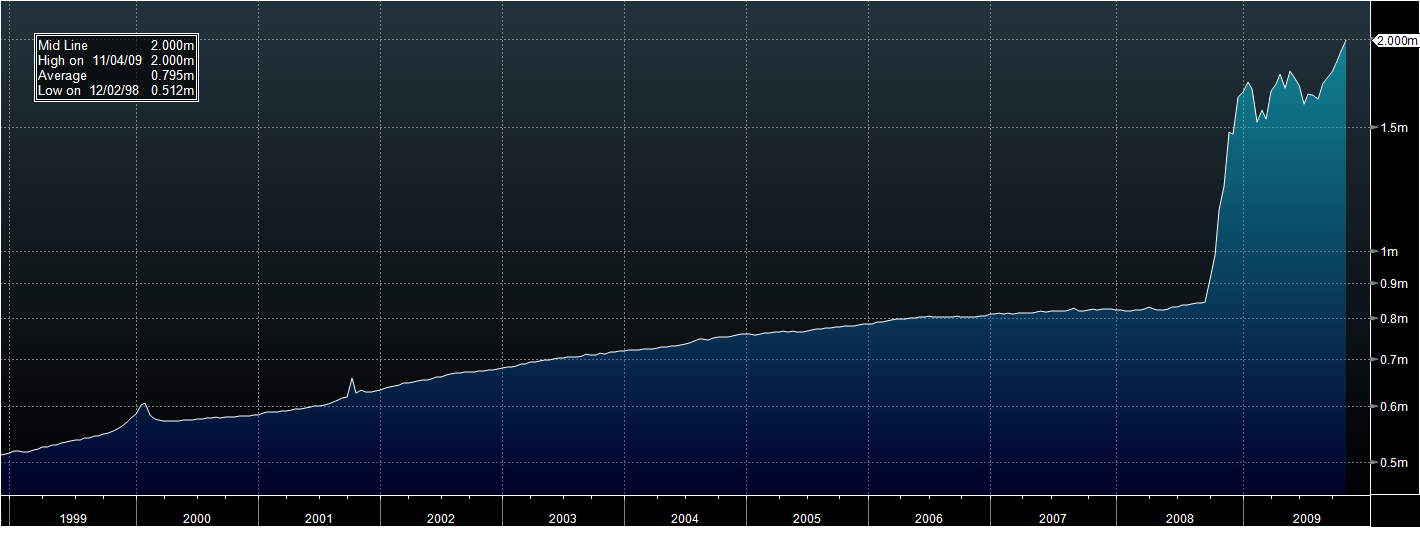
US Monetary Base Expansion

US Monetary Base Expansion

It's gone bonkers!!!


US Monetary Base 1998 - Present
http://static.seekingalpha.com/uploads/2009/11/9/439442-125776588647795-Thomas-MacLeod_origin.png

439442-125776588647795-Thomas-MacLeod_origin.png (PNG Image, 1420x546 pixels)

US Monetary Base 1970 - Present


The Master Blog
www.masterdjm.blogspot.com

ShareThis

Gold or Silver?

MasterSearch