MasterSearch

Showing posts with label Fed. Show all posts

Thursday, October 06, 2011

Fed Is 4 Times More Efficient At Selling Government Bonds Than The US Treasury... With A Taxpayer-Funded Twist


Fed Is 4 Times More Efficient At Selling Government Bonds Than The US Treasury... With A Taxpayer-Funded Twist

Fed Is 4 Times More Efficient At Selling Government Bonds Than The US Treasury... With A Taxpayer-Funded Twist

Saturday, February 12, 2011

M2 Grows By $40 Billion In One Week, Hits Fresh All Time High | zero hedge

M2 Grows By $40 Billion In One Week, Hits Fresh All Time High | zero hedge


Just in case someone was confused about the relationship between liquidity, currency devaluation and nominal (not real) asset prices, the St. Louis Fed was kind enough to email us their weekly M2 level. 

And after last week's surprising drop, M2 once again rose, this time by a whopping $40 billion. Oh and before someone says that M3 is still declining, it isn't. Or rather the much more important monetary aggregate, that including all shadow banking liabilities is now increasing as we indicatedduring the last Z.1 spread. In one month, when the next Flow of Funds report is released we are confident we will confirm that in Q4 shadow banking increased by at least half a few hundred billion on an annualized basis. In other words the central bank reliquification is now on in full force, both in America and in every other place that has central banks. Which also explains why central banking hawks are now virtually extinct (cf: Axel Weber)

_______________________________________
Check it out on The MasterCharts

Tuesday, November 30, 2010

Your One-Stop Guide To Frontrunning Monday's Double POMO | zero hedge

Your One-Stop Guide To Frontrunning Monday's Double POMO

Sunday, October 31, 2010

No Gold Or Silver Bubble Says Sprott's John Embry

No Gold Or Silver Bubble Says Sprott's John Embry
Source: zero hedge
 26 October 2010 


On one hand, one has professional stock bubble top-tickers (of the variety that would benefit from some error-checking)-cum-amateur precious metal pundits claiming that the gold bubble is unmistakable. On the other, there are those who have made hundreds of millions of dollars for their investors actually investing in precious metals, such as in this case Sprott's John Embry, who states that there is no bubble in either gold or silver. "Jim Rogers, who is one of the world's leading authorities on commodities, dealt with the bubble issue recently by recounting an interesting anecdote. While addressing a group of high-end money managers, he inquired as to how many of them held gold or silver in their accounts, and remarkably, 75% replied they had never owned either precious metal. When gold is trading at several multiples of the current price at some point in the future, you can be assured that every single person at a similar gathering would be long and then discussion of a bubble might be legitimate. In my considered, opinion we are many years and thousands of dollars away in price from that debate." Whom does one believe? That's obviously rhetorical. Amusingly, Embry takes a stab at the Financial Times, which he dubs a conduit for the establishment: "The FT has been speaking much less disparagingly about gold recently. The paper consistently denigrated gold and its change in tone might be instructive." Of course, a variety of second-rate media outlets are more than happy to step in and fill the "goldbug" bashing void in the FT's absence.

Full recent thoughts from Embry (pdf):


Embry Oct22

Read more…


Wednesday, October 27, 2010

do the Credit markets paint bullish picture for Equity markets?

BMO seems to think so…


Figure 1: S&P Global 1200 and Sovereign Default Risk          

Description: cid:image003.jpg@01CB74E0.40F9A530

Figure 2:  S&P 500 and North American Inv. Grade CDS

Description: cid:image004.jpg@01CB74E0.40F9A530


Figure 3: Credit Default Swap Section of Equity Screening By.


Figure 4:  Bank of America Equity/CDS Overlay


Saturday, October 09, 2010

Tuesday, October 05, 2010

Financial Times: The global implications of QE2

October 04 2010 2:11 PM GMT
The global implications of QE2
--
By Gavyn Davies
--
Gavyn Davies on the global effects of another round of quantitative easing from the Federal Reserve

Read the full article at: http://www.ft.com/cms/s/0/4e74bd74-cfb9-11df-a51f-00144feab49a.html?ftcamp=rss


Sent from my iPad

Wednesday, August 25, 2010

Richard Russell's Daily Letter

August 24, 2010 - "I place economy among the first and most important virtues and public debt as the great danger to be feared. To preserve our independence, we must not let our leaders load us with perpetual debt. We must make our choice between economy and liberty, or profusion and servitude." Thomas Jefferson. 
...................................................................................


Throw a tennis ball up in the air, and it will lose upward momentum as it rises. At some point upside momentum will completely fade, and the ball will stand still in mid-air. After standing still for a brief moment, the ball will head back toward earth.


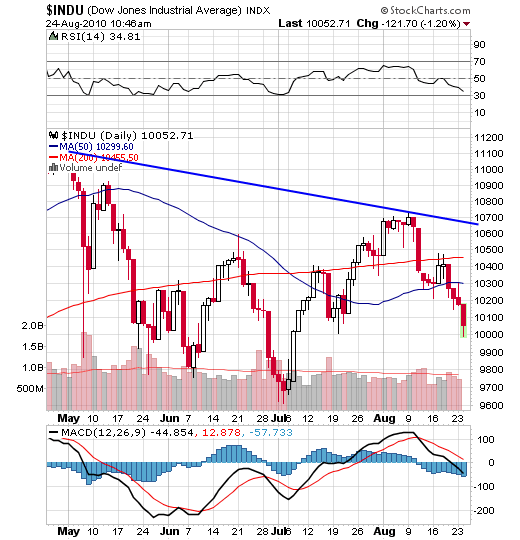
Somehow, I get the same feeling about the stock market. The market gained initial upside momentum as it surged up from its July low. By early August the market had lost upward momentum. For seven days the Dow moved sideways as if suspended in midair. On August 11, the market suddenly plunged 265 Dow points, and in so doing it fell out of its sideway trading range. From there, the Dow whipped back and forth, and by August 19, the Dow had fallen bearishly below both its 59-day and 200-day moving averages.


The daily chart below shows us what the Dow looks like now. Note that RSI is heading down, and MACD has turned negative. At the same time, the Dow is situated below its 50-day moving average, and the 50-day MA, in turn, is below its (red) 200-day MA. Finally, note that the Dow has assumed the form of a head-and-shoulders top that has now broken down. In all, a classic set of bearish relationships. 


I'm including a P&F chart of the Dow below. Note the latest red column of X's which just plunged below the 10150 box and below the rising blue trendline. According to this P&F chart, we received a "sell signal" this morning when the Dow broke below the preceding column of 0s and below it rising blue trendline. The P&F "projection" is that this break should take the Dow down to the 9750 box.


Incidentally, there is no shortage of "distribution days." The latest score for the last two weeks is -- 6 for the S&P 500, 5 for the Dow, 5 for the NASDAQ and 5 for the NYSE Composite. That's far too many, and it implies heavy institutional selling.
Yesterday, I wrote about the Treasury bonds. Every "smart" trader and investor has rushed into Treasury bonds as the ultimate save-haven area. I believe Treasury bonds and high-grade corporate bonds are in a bubble. There are just too many believers in bonds as the ultimate safe place to be. 


When everybody piles onto one side of the ship, the ship lists. And just as quickly, everybody rushes to the other side of the ship. That's where I think we are with bonds. 


The weekly chart below follows the 30-year T-bond. RSI tells us that the bond is overbought. The full stochastics at the bottom of the chart confirms that the bond is overbought. And the blue histograms are slanting downwards towards zero. All in all, I don't like the looks of the bonds. Any hint of rising interest rates could send the bond market off the edge of the popularity cliff. 


Gold -- I took today's stock market sell-off as an indication that business will be rotten in the months ahead. Rotten business will put pressure on the Fed to print, print, print. Wide open quantitative easing will put pressure on the dollar, and this, in turn, will put UPWARD pressure on gold. And gold may have started to discount that situation today.


Share |
_______________________________________
Check it out on The MasterCharts

Saturday, August 21, 2010

Gold: The Enemy of Currencies

Gold: The Enemy of Currencies
Last week saw gold prices rise despite deflationary fears.
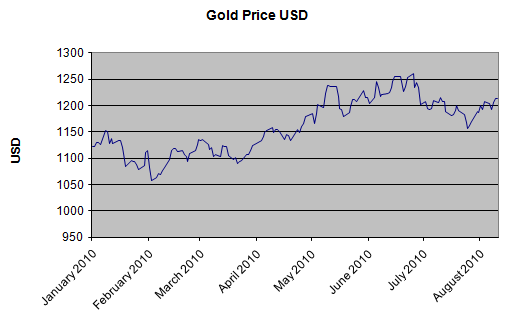
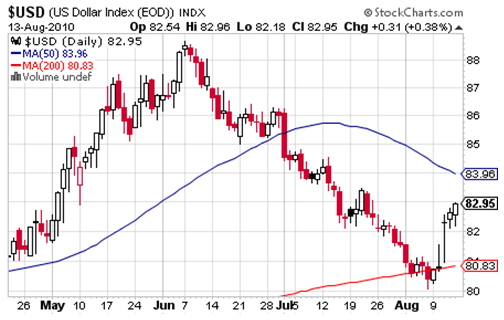
Taking a look at the chart below we can see the gold price in US dollars has traded in a narrow range since May. This is despite the dollar declining for much of that time, see chart further below. (Click to enlarge)
 

 We noted last week that we were going to keep an eye on the Fed Open Market Committee meeting in case they decided to increase the money supply even further. But they didn’t.

The Federal Open Market Committee failed to commit to anything... they didn’t say they would resort to more quantitative easing... they didn’t say they wouldn’t. Instead they’re pausing for breath.

The inflation, deflation debate continues 
As the deflationary, inflationary debate continues to be waged between financial heavyweights we stand on the side and watch. We’ve always believed the act of quantitative easing is inflationary; It inflates the money supply. We also think the governments only way out, of this huge debt burden it has imposed upon itself, is to inflate the debt. If you make the value of your debt less you have less to pay back, but it’s a juggling act. Inflate too much and you run the risk of hyperinflation, something that, the Germans will tell you, doesn’t bode well for an economy.

US Trade Deficit
What’s the next move for gold? We have to wait and see what happens around the globe to find that out. Certainly, its course is no longer dictated by the movement of the dollar as much as it once was. Will this relationship resurface? Probably, but when it does it will most likely be when the dollar makes a significant move, triggering panic in the dollar or gold.

Which is more likely – a panic or strength in the dollar?
Last week Bloomberg reported that the US trade deficit has swelled to an incredible figure:
“The U.S. trade deficit widened by $7.9 billion in June, the most since record-keeping began in 1992, to $49.9 billion, a report from the Commerce Department showed. Exports posted the biggest decline since April 2009.

“Investors should prepare for “major structural changes” as the global economy shifts to slower growth, Mohamed A. El- Erian, chief executive officer at Pacific Investment Management Co. said yesterday in a radio interview on “Bloomberg Surveillance” with Tom Keene.”

This news reverberated around the markets.

A quick look at the VIX index shows us that fear has reentered the market... again. At the far right of the graph you can see the index rises sharply which signifies a growing fear of volatility in the markets.


With a stuttering economy and growing tension between the US and China, the trade balance could play a huge role in a dollar devaluation. But in order for the dollar to drop further people will have to lose faith in its safe haven status. Which means an alternative currency will need to take its place. The problem with this scenario is that there aren’t too many other candidates for the role as a global reserve currency. And whilst that is the case gold can continue to take center stage.

Will things get better?
In the grand scheme of things the debt, from Dubai to Greece has just been shuffled around. The run up in the stock markets suggests stability but investors are cautious. They’re wondering if this is another ‘suckers rally’. And they’re right to be cautious. If you play with fire... well you know that old saying. In other words it doesn’t end well.
Can things get better? That depends on what governments do.

More money printing can only add to the attractiveness of gold. But gold is the enemy of currencies. As Alan Greenspan once noted, to control the dollar you have to control the gold price.

The fight for governments around the world is one which is traded in blows against the gold price. And should they win the price of gold may very well settle back to lower prices until supported by a strong level of jewelry demand. But this is dependent on currencies being kept under control. Both the US and the UK have not ruled out further money printing, and with each new wave of money the original currency is worth less and less.

It all sounds too reactionary to us. There doesn’t seem to be a grand plan. Maybe there cannot be as the markets lead themselves. But whatever the case, none of the actions by those in power have any finiteness about them. There’s no plan and no control.

Disclosure: No positions
http://seekingalpha.com/article/221174-gold-the-enemy-of-currencies?source=feed
Share |
_______________________________________
Check it out on The MasterCharts

Friday, August 20, 2010

If This Were A Stock....

If This Were A Stock....


By Guy M. Lerner
TheTechnicalTake
http://thetechnicaltakedotcom.blogspot.com/
See figure 1 a weekly price chart. The 40 week moving average (i.e, red line) is
heading higher, and prices are trading above key pivot points, which are areas of
support (buying) and resistance (selling). In essence, this is a "beautiful" chart with
lots of momentum (i.e., note the breakout gaps). If this were a stock, the analysts
and pundits would be all over the "breakout" ---blah, blah, blah.
Figure 1. Price Chart/ weekly
But figure 1 isn't a stock, it is the yield on the 30 year Treasury, and the chart has
been turned upside down. What I hear and read is this move in Treasury bonds isn't
sustainable. A sub 3% yield isn't possible, but isn't that what "they" said about a sub 4%
yield? Which happens to be in the rear view mirror.
People still don't believe, and they are not interpreting the significance of the price
action correctly. Maybe if this were a stock people would be wowed by the price
action. But they aren't. For the record, figure 2 is a weekly chart of the yield on the
30 year Treasury bond (symbol: $TYX.X). Are the low yields of late 2008 the next
stop?

If This Were A Stock....

_______________________________________
Check it out on The MasterCharts

Thursday, August 19, 2010

Bankruptcies: Going for broke | The Economist


Bankruptcies: Going for broke | The Economist: "Bankruptcies rise in America
Aug 18th 2010

BANKRUPTCY filings rose 20% in the year to June 30th compared with the previous 12-month period, according to statistics released on August 17th by the Administrative Office of the US Courts. This takes quarterly filings to their highest point since tougher bankruptcy laws were introduced at the end of 2005. That change brought a spike of bankruptcies, as companies and individuals rushed to declare themselves broke under the more lenient old regime. The data suggest that an older trend is reasserting itself. This is could be more bad news for America—or it could just mean that creative destruction is alive and well."

________________________

Thursday, August 12, 2010

FT.com / FT's rolling global market overview - Investors take fright at Fed warning


Investors take fright at Fed warning

ByTelis Demos in London
Published: August 11 2010 09:04 | Last updated: August 11 2010 22:06
Wednesday 21.30 BST. US stocks are tumbling sharply as risky assets react to the Federal Reserve’s decision to downgrade its outlook while at the same time growth in other regions looks to be at its weakest for the year.
The Fed’s move to pump up a flagging recovery by buying Treasury bonds with mortgage-backed security proceeds has led to a rush to haven assets. The yen finally broke through to its strongest point since 1995 – at Y84.71 to the dollar, which it has been nearing for weeks.
With the Fed now a buyer of debt, some US government bonds saw record low yields, as did bonds in other markets as investors fled risky assets. An auction of 10-year Treasuries saw the lowest yield of any sale since January 2009.
Equity markets have been severely disappointed by the Fed’s downgrade of its outlook and in its rather tepid response to that outlook (the Fed’s balance sheet will not actually expand). The FTSE All-World stock index has fallen 2.7 per cent to late July levels, its strongest move since June, led by a 2.8 per cent decline in the S&P 500 index.
“The Fed delivered the minimum that had been expected,” said Hans Redeker, global head of foreign exchange strategy at BNP Paribas.“

The Market Eye

Markets saw a pillar of calm wobble today: the relatively high yields on 30-year debt.The recent trend has been of weakness at the back of the curve, suggesting investors were not expecting serious deflation. But today 30-year yields came in, and the spread with 10-years narrowed. It’s still near all-time record highs, so views haven’t shifted, only slid slightly. Plus, the move is likely short-lived, given the way that markets trade on Fed moves. Steven Major, head of fixed-income research at HSBC, says distortion is the rule-of-thumb in these situations:
“Given that this action by the Fed was well telegraphed, Treasury yields have moved lower in a move which is beyond what we expected,” he said. “The biggest moves tend to happen when markets are salivating about the prospects. Normally when an expected event happens, the reaction is a damp squib.”
Mr Major said that given the markets’ bearish tilt on the economy, yields on 10-year US Treasuries could fall as low as 2 per cent, from
2.69 per cent currently. That would blow the curve right back out to record levels.
A report that the US trade deficit widened again in June to 2009 levels sent its own shockwaves through markets. Combined with a slowdown in industrial production in China to two-year lows, and a drop in machine orders in Japan, it confirmed suspicions that the rest of the world would not be able to help the world’s biggest economy grow.
“Without earnings season holding us up, investors are focusing on the bad news,” said Jonathan Corpina, a senior partner at Meridian Equity Partners and trader on the New York floor. “We heard this language from the Fed on Tuesday. Really it was the combination with the numbers from China and the trade balance that put extreme pressure on our markets today.“
Crude oil’s decline also accelerated following a warning from the International Energy Agency that the Gulf of Mexico oil spill may restrict supply in 2011. It has slipped below $80 a barrel.
The fears for global growth were especially sharp in Europe, where oddly the dollar surged against the euro in spite of monetary loosening in the US.
“Investors are looking at Europe and saying, ‘I don’t care about policy tightness’. If the US has a real risk of weakness, then that raises risks for growth everywhere in the world,” said Eric Fine, manager of G-175 funds at Van Eck Global.
The euro is at its lowest level since before the bank stress tests last month. German 10-year Bunds are also at record low yield levels as “peripheral” European bonds from Greece and Spain are sold-off.
Europe. Mervyn King, governor of the Bank of England, said in his inflation outlook that economic growth would slow to below-target levels. The UK also saw a stark drop in consumer confidence and fallingemployment growth. Like the Fed, the Bank announced that quantitative easing would continue, but not extended to new levels.
The FTSE 100 index dropped 2.4 per cent, falling further after Wall Street’s weak opening, but already weak following the UK’s dismal data and the Bank of England’s unwillingness to provide new monetary relief. Germany’s Dax closed down 2.1 per cent. Basic materials, closely tied to demand in China, and cyclical technology and financial shares are the laggard sectors.
• Asia. The Nikkei 225 average fell 2.7 per cent as the yen jumped following the Fed decision. A stronger yen has weighed on Japanese export companies. Japan also said that industrial orders rose only 1.6 per cent in July, versus a forecast of 5.5 per cent growth.
Chinese shares were also lower on the poorer industrial growth figures. The mainland Shanghai Composite index was down by 0.5 per cent and the Hang Seng index in Hong Kong dropped 0.8 per cent, falling lower as it neared the close.
• Currencies. The yen has since bounced off its low of Y84.79, and is now up 0.1 per cent at Y85.38. Considerations such as haven buying for the dollar, and the risk of Japanese intervention in the market, have kept the currency from rising further.
The euro is down 2.3 per cent at $1.2870, its steepest one-day drop since January 2009. It has given up all its gains following the well-received bank stress tests. The yen is surging 2.4 per cent against the euro to Y109.89.
The pound was hard-hit following a jobs report in which the decline in jobless claims slowed, and the Bank of England’s inflation report. Sterling is down 1.2 per cent, at $1.5665, after falling more than 1 per cent in the previous session.
The New Zealand dollar is off 1.2 per cent against the yen and the Australian dollar is down by 1.7 per cent against the US dollar. Both currencies closely track commodities and interest rates, which rise with growth hopes.
• Debt. The German 10-year Bund was the sharpest mover, with the yield falling 11 basis points to 2.43 per cent, a new record low.
Japanese 10-year yields fell 2 basis points to 0.999 per cent.
The yield on the US 10-year Treasuries is down 7 basis points to 2.69 per cent, off its lowest point since February 2009 hit earlier in the session. Five-year bonds, 7-year, and 2-year bonds also dipped to record-low yields, though they had recovered slightly as the session wore on.
Gilt yields also fell sharply, with 10-year bonds down 11bp to yield 3.14 per cent, their lowest since April 2009 following the Bank’s dovish outlook. An auction on Tuesday saw long-dated gilts pricing at below-market yields, though not strongly in demand by investors.
• Commodities. Benchmark crude oil is falling further past $80 a barrel, now at $77.51, down 3.4 per cent.
Gold, in one of the few signs of reassurance, is down just 0.5 per cent at $1,199 an ounce. Bullion interests investors as the risk of monetary inflation rises and the Fed’s relatively cautious move has evidently not sparked a change in fears of either inflation or deflation.
However, traders cautioned that big moves in gold may be muted by liquidations that raised cash for investors fleeing risk.
Follow the Global Market Overview on Twitter @telisdemos
(Jamie Chisholm is on holiday)

Saturday, July 31, 2010

The MasterBlog: "It's Not A Market, It's An HFT 'Crop Circle' Crime Scene" - Further Evidence Of Quote Stuffing Manipulation By HFT | zero hedge

High Frequency Trading - HFT - OR THE SCAM IN THE MARKET....


"It's Not A Market, It's An HFT 'Crop Circle' Crime Scene"

- Further Evidence Of Quote Stuffing Manipulation By HFT

Monday, April 19, 2010

Slide in Gold: The Euro, China and Goldman Sachs -- Seeking Alpha

Slide in Gold: The Euro, China and Goldman Sachs -- Seeking Alpha
Gold fell the most in two months as the SEC’s action against Goldman Sachs (GS) spurred investors rushing out of riskier commodities and into perceived safer assets such as the U.S. dollar. Futures for June delivery slid 2% in one day to $1,136.90 an ounce.

Paulson Linked to Goldman’s Case

Goldman Sachs, the largest U.S. commodity broker, is charged with defrauding investors with a financial product tied to subprime mortgages by the Security Exchange Commission [SEC]. In addition, hedge fund Paulson & Co. is also mentioned by the SEC, but not charged, in connection with the Goldman Sachs matter.

Paulson & Co. is the largest institutional holder of the SPDR Gold Trust (GLD) with about 8.4% stake, whereas Goldman Sachs also holds the 11th largest stake at 0.6% in the fund, according to Bloomberg data. SPDR is the world’s biggest exchange-traded fund backed by physical bullion, with a record gold holding of 1,141.041 tons as of April 15.

Goldman & Paulson Massive Gold Positions

Paulson's high-profile bets have partly helped drive gold to record-high prices above $1,200 an ounce. Although no charges were brought against the hedge fund, the double whammy news weighed on gold, and prompted some concern in the commodity markets, since Goldman Sachs is a major player with massive positions in all commodities including gold, silver and crude oil.

An Overdue Technical Correction

Typically, when market confidence is shaken by events such as the SEC Goldman suit, it should spell bullish for gold -- an independent store of value. However, even before the Goldman news, gold, which rallied to a four-month high of $1,170.70 on April 12, was poised for a technical correction. So, the Goldman news most likely just triggered an exit opportunity for short-term traders to lock in profits from recent gains.

Gold-Euro Affair by PIIGS

Gold futures have been in an uptrend recently and rallied more than 11% from a multi-month low in February. The metal remains near record highs in euro and pound more on account of the currency weakness, and not due to the performance of the metal itself. (Click on chart to enlarge)
Both the euro and sterling pound had declined around 6% against the dollar in the first quarter of 2010, as the U.K.'s and PIIGS countries' fiscal deficit crossed the 12% mark of respective GDPs, much higher than the EU's prescribed limit of 3%.
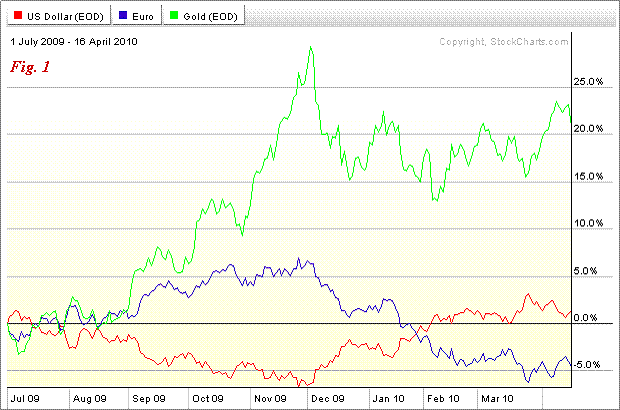
With investors rotating out of the euro and into alternative assets like gold and the U.S. dollar on concerns of the Greece debt crisis, the historically negative correlation between gold prices and the dollar index has been broken since last December.
Instead, gold is now trending more positively with the dollar and inversely with the euro. (Fig. 1)

Watch EUR / USD
Over the near term, gold will keep looking to the dollar / euro relationship for direction with the euro dictating gold’s price.
The ongoing Greek debt saga has been a key driver of investors' risk appetite. The EU already indicated Portugal may need to enact additional measures if it’s to cut its budget deficit.
Concerns of further fiscal crisis contagion into other members in the European Monetary Union could seal the euro’s fate of a continuous downward spiral against the dollar in the near term.
However, given the mountainous US deficits, it looks likely gold could reach record (nominal) highs in dollars as well in the medium term.


Technical Indicators
The U.S. Commodities Futures Trading Commission [CFTC] report indicated speculative financial investors seem to have become increasingly reserved and have been trimming their net-long positions in recent weeks. Commercial participants, who accounted for 51.3% of open interest, held net short positions at the end of March. (Click on chart above to enlarge)
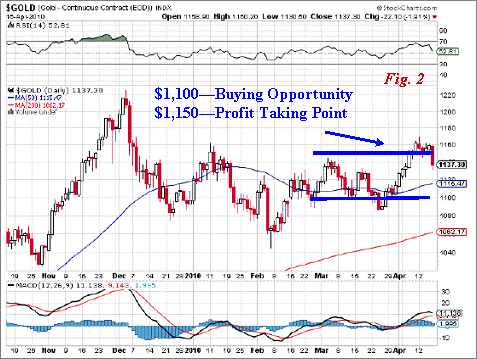
A further increase in the net short position, coupled with the negative sentiment stemming from Goldman / Paulson could put the gold price under pressure and test the psychologically important $1,100 mark.
For the time being, a dip below the $1,100 should provide investors with a buying opportunity and a rise above $1,150 would serve as a profit-taking signal. (Fig. 2)
Technicals aside, gold’s long term outlook is further solidified by a couple of new “China factors.”


China Gold Demand to Double
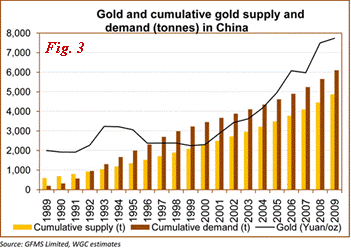
Gold demand in China has steadily increased since 1992, accounting for 11% of global gold demand in 2009. The World Gold Council forecasts demand doubling in the next 10 years from $14 billion to $29 billion on rising jewelry and investment demand.
Currently China's per capita gold consumption level lags most other major gold buying countries. Although China is the world’s largest gold producer, rising domestic demand for gold outstripped domestic supply by 109 metric tons last year. This shortfall creates a "snowball" effect as China's gold industry has to rely on imports, the World Gold Council said. (Fig. 3)


Boosted By A Stronger Yuan?
Meanwhile, some analysts also think a stronger yuan could be a catalyst to spur China’s gold demand. China might revalue its currency--the yuan or renminbi--after a recent meeting between U.S. Treasury Secretary Timothy Geithner and Chinese vice Premier Wang Qishan. Some analysts argue that the yuan is undervalued by as much as 40%.
A stronger yuan could support higher gold prices as the precious metal becomes cheaper to buy. Beijing has been encouraging citizens to buy gold and silver, a rise in yuan would certainly facilitate more buying.
According to the Associated Press, China let the yuan appreciate almost 20% between 2005 and 2008, during which gold prices touched $1,000 an ounce for the first time.

Underpinned By Fear & Uncertainty
Although it would seem that the Goldman-linked SEC case single-handedly killed the price of gold last week, as discussed here, it was only a catalyst to a technical correction that was overdue.
The fact remains that in times of uncertainty, investors historically turn to gold as a hedge against inflation and unforeseen crisis since gold is one of the very few asset classes that is not someone else's liability.
Many experts argue that gold is not an effective hedge against inflation since the then-record $873 an ounce established in 1980 should appreciate to $2,287 in terms of today’s dollar.
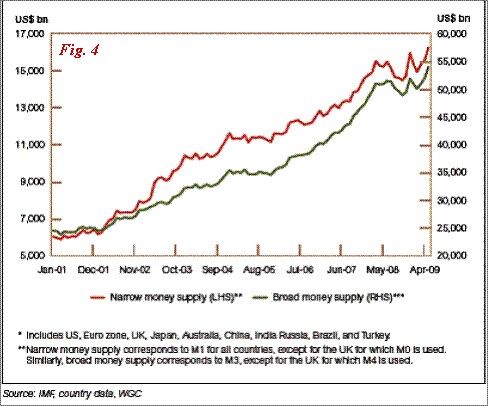
However, fear of any sort usually does translate into higher gold prices. One hypothesis is that the seemingly slow and steady inflation is not explicitly overt enough to cause an overwhelming fear of inflation yet. Nevertheless, the record government debt levels and monetary printing machines will most certainly heighten investors' inflation concerns and push gold prices much higher over the long term. (Fig. 4)
Disclosure: No positions
About the author: Dian L. Chu
Dian L. Chu, M.B.A., C.P.M. and Chartered Economist, is a market analyst and financial writer regularly contributing to several leading investment websites. Ms. Chu's work is also syndicated to media outlets worldwide. She blogs at Economic Forecasts & Opinions. 程甸蘭 市場分析師,... More

ShareThis

Gold or Silver?

MasterSearch