Subscribe to The MasterCharts Feed Subscribe to The MasterCharts by Email

MasterSearch

Tuesday, December 08, 2020

Monday, October 19, 2020

#Grains - #Wheat - The upcoming big bull market $WEAT $CORN $SOYB $DBA $NTR $DE

$WEAT

Wheat prices have been strong lately (attachment 1). We have been writing for some time that we expect a major bull market in The grains complex: corn, soybeans and wheat.  

As the 10-year chart shows, wheat futures hit a 6-year high and look to be finally breaking out on the upside after a 6-year bottom formation. 


We have been signaling, since August and again in Septemberthat this “stealth” bull market is just Getting started. This offers investors with the potential for some major medium to long-term gains, notwithstanding the short term volatility.  

Friday, September 18, 2020

Rally in #Grains & #Agriculture Stocks Just Getting Started $NTR $CORN $DBA $SOYB


$CORN

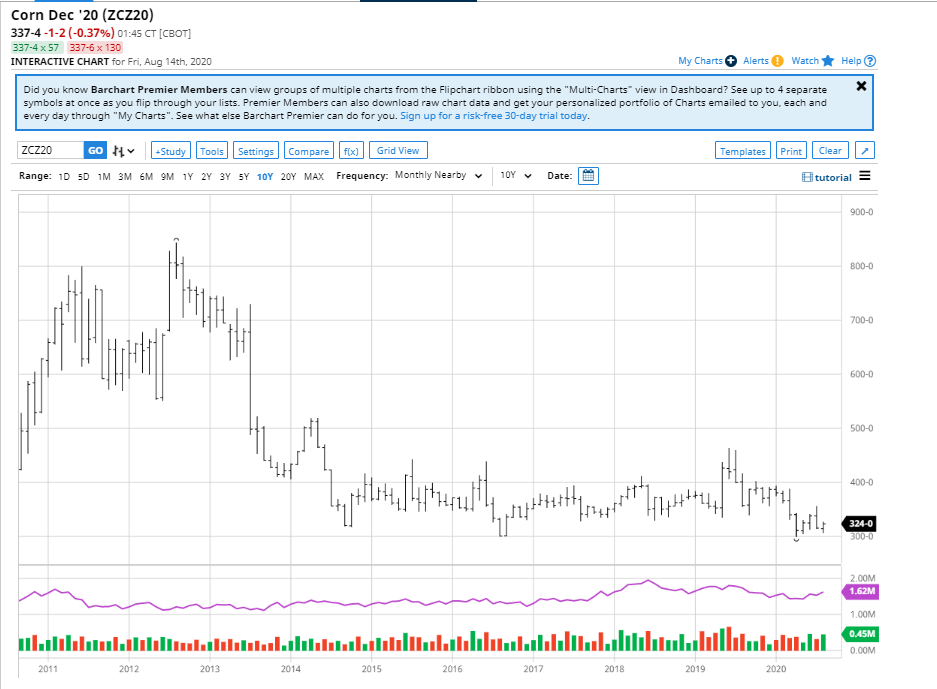
Continuing with our previous comments on the coming bull market for grains, Soybeans $SOYB (attachment 1), Corn $CORN (attachment 2) and Wheat $WEAT (attachment 3) had a strong day yesterday.

Attachment 4 displays the strong corn sales in the new marketing year, which began on September 1, 2020 (see text below).

Tuesday, August 25, 2020

Bullish Pennant Formation on #Gold? Or will it break down? $GLD

Gold

#Gold trading in a tight range. Will the old high continue to serve as support and break out? Or will it break down, with a potential $100 drop in the cards?

bit.ly/MasterCharts

Friday, August 14, 2020

#Grains - Another #BullMarket in the making $CORN $WEAT $SOYB $JJG


Looks like the grains complex is preparing for a big bull market. The main reason seems to be the climate.

Grain prices tend to be volatile. So buy and hold is not the answer. 

Better to trade the grains. 

Attachments 1 to 3 are daily charts of the futures contracts of Corn, Wheat and Soybeans. All of them had positive price changes in the last 2 days.

Friday, June 12, 2020

$VIX Explodes as the Market Crashes

VIX
Yet markets recovering in early Asian trading...


Share
_______________________________________
Check it out on The MasterCharts

Wednesday, April 22, 2020

#Gold main Trend Up, but Momentum Trending Lower

"main trend is up according to the daily swing chart, however, momentum has been trending lower since last Thursday. A trade through $1788.80 will signal a resumption of the uptrend. A move through $1576.00 will change the main trend to down.

"The new minor range is $1788.80 to $1666.20. Its 50% level or pivot at $1727.50 is potential resistance. Watch for aggressive countertrend sellers on the first test of this level. They are going to try to form a secondary lower top.

"The short-term range is $1576.00 to $1788.80. Its retracement zone at $1682.40 to $1657.30 is potential support. This zone helped stop the selling pressure on Tuesday at $1666.20."

Read the whole analysis here: https://finance.yahoo.com/news/gold-price-futures-gc-technical-050734016.html


________________________
bit.ly/MasterCharts

Upside-down, Right-SideUp #HeadAndShoulders: Mixed Technical Picture for #Gold


The upside down #HeadAndShoulders Will take us where?

http://schrts.co/UeAvkAkv


Are we seeing the beginning of a #HeadAndShoulders here?

http://schrts.co/TugdrQWc
Should be an interesting year ahead....
See the post on MasterMetals
@MasterMetals

Thursday, March 05, 2020

#Dollar-#Euro has had a wild ride in the last month...


Share
_______________________________________
Check it out on The MasterCharts

Friday, February 07, 2020

#Commodities under pressure due to #Coronavirus $CRB $GCC

Commodities have been under pressure lately as the Coronavirus situation gives fears of a worldwide slowdown of economies.

A vehicle to play is the Wisdom Tree Continuous Commodity Index Fund ETF, symbol GCC, US$ 17.74. GCC tracks an equal-weighted index of 17 commodities.

It uses futures contracts averaged across the nearest 6 months of the futures curve to maintain its exposure and rebalances daily. Each commodity is weighted around 5.9%. (Attachments 5&6)

Attachment 1 displays the CRB Reuters/Jefferies CRB Index. The index comprises 19 commodities but is heavily weighted in energy with oil being weighted 23%. Together with natural gas and gasoline, the energy sector is weighted way over 30% (attachment 2).


ShareThis

World Climate Widget

MasterSearch


MasterCharts