Subscribe to The MasterCharts Feed Subscribe to The MasterCharts by Email

MasterSearch

Tuesday, August 31, 2010

IRS Hiring Special Agents for Criminal Investigation Division - Finance Career Management, Finance Career News - fins.com


IRS Hiring Special Agents for Criminal Investigation Division - Finance Career Management, Finance Career News
fins.com


Come one, come all: The IRS is hiring for one of its prime divisions.
The agency expects to get $5.1 million to spend on hiring for its Criminal Investigation Division -- though an agency spokesman could not say exactly how many the IRS is looking to hire.
A recently-released report from the Treasury Inspector General for Tax Administration (TIGTA) that assesses the Division's performance states that special agent staffing has increased 4.1% from last year, from 2,617 to 2,725. But the difference of 108 positions represents the net between 312 newly hired agents and the loss of 204 experienced agents. Overall, the number of field special agents has decreased 10.2% since 2004.
This new hiring comes in the wake of last year's push for 800 new employees to scour the world in search of American tax evaders.
The turnover has resulted in fewer case completions than in previous years. Last year, TIGTA expressed concerns that the Division would fail to "reduce the pipeline inventory." That worry was justified. Even though the Division reduced its completion goal from 4,000 to 3,900, it still came up 52 investigations short in 2009.
As the recent kerfuffle between U.S. and Swiss authorities over the transfer of tax data indicates, the premium placed on routing out international tax schemes has reached an all-time high, and the IRS needs agents around the world to act as gumshoes. According to the report, "the international initiative will require increased hiring and include a broader range of cases and sharply increased presence in other countries."
While an IRS spokesman could not give a full outline of the hiring initiative, he did highlight some of the necessary qualifications that can be found on the IRS' website:

-- Younger than 37, unless you've served in a federal law enforcement position before.
-- Prime physical condition (you'll be tested on it).
-- Gun-shooting experience.
If you're comfortable with all of the above and you like the sound of Special Agent [Your Name Here], you may want to consider applying.


IRS Hiring Special Agents for Criminal Investigation Division - Finance Career Management, Finance Career News - fins.com: "IRS Hiring Special Agents for Criminal Investigation Division
By Julie Steinberg"

Share
_______________________________________
Check it out on The MasterCharts

Monday, August 30, 2010

MasterTech: RIM = RIP ? Research in Motion Continues Its Downwa...

RIM = RIP ?

Sounds like TAPS in the background....

Between the pressure on the corporate side of the business from governments who want access to all the data passing through the blackberries in their countries, and the real risk of migration by consumers to the iPhone and Android OS, the future doesn't look too bright RIM...

Below are charts.  The whole story can be seen on The MasterTech Blog or directly on zerohedge.com.
As Research in Motion Continues Its Inevitable Downward Descent In Both Equity Value and Market Share, Investors Should Tweak Their Assumptions Accordingly
Research in Motion's recent equity share decline stems not only from market share loss, but from the apparent lack of a clear cut and believable plan to stem that market share loss.

Research in Motion, is still currently the market leader in terms of share, but is losing both demonstrably and rapidly in new users. As a matter of fact, if the recent historical trends persist, this is the last quarter that RIM will be able to claim the top of the market title as Android looks well situated to claim that crown.


As can be seen from this chart, Android is just about there. Apple will probably show better numbers in Q3 with additional evidence of iPhone 4 adoption as well.
So, although RIM is looking quite cheap now, it is quite possible for it to look much cheaper. The question is how does this market share loss factor into its equity valuation.


MasterTech: Research in Motion Continues Its Inevitable Downward Descent In Both Equity Value and Market Share

_______________________________________
Check it out on The MasterCharts

Wednesday, August 25, 2010

Richard Russell's Daily Letter

August 24, 2010 - "I place economy among the first and most important virtues and public debt as the great danger to be feared. To preserve our independence, we must not let our leaders load us with perpetual debt. We must make our choice between economy and liberty, or profusion and servitude." Thomas Jefferson. 
...................................................................................


Throw a tennis ball up in the air, and it will lose upward momentum as it rises. At some point upside momentum will completely fade, and the ball will stand still in mid-air. After standing still for a brief moment, the ball will head back toward earth.


Somehow, I get the same feeling about the stock market. The market gained initial upside momentum as it surged up from its July low. By early August the market had lost upward momentum. For seven days the Dow moved sideways as if suspended in midair. On August 11, the market suddenly plunged 265 Dow points, and in so doing it fell out of its sideway trading range. From there, the Dow whipped back and forth, and by August 19, the Dow had fallen bearishly below both its 59-day and 200-day moving averages.


The daily chart below shows us what the Dow looks like now. Note that RSI is heading down, and MACD has turned negative. At the same time, the Dow is situated below its 50-day moving average, and the 50-day MA, in turn, is below its (red) 200-day MA. Finally, note that the Dow has assumed the form of a head-and-shoulders top that has now broken down. In all, a classic set of bearish relationships. 


I'm including a P&F chart of the Dow below. Note the latest red column of X's which just plunged below the 10150 box and below the rising blue trendline. According to this P&F chart, we received a "sell signal" this morning when the Dow broke below the preceding column of 0s and below it rising blue trendline. The P&F "projection" is that this break should take the Dow down to the 9750 box.


Incidentally, there is no shortage of "distribution days." The latest score for the last two weeks is -- 6 for the S&P 500, 5 for the Dow, 5 for the NASDAQ and 5 for the NYSE Composite. That's far too many, and it implies heavy institutional selling.
Yesterday, I wrote about the Treasury bonds. Every "smart" trader and investor has rushed into Treasury bonds as the ultimate save-haven area. I believe Treasury bonds and high-grade corporate bonds are in a bubble. There are just too many believers in bonds as the ultimate safe place to be. 


When everybody piles onto one side of the ship, the ship lists. And just as quickly, everybody rushes to the other side of the ship. That's where I think we are with bonds. 


The weekly chart below follows the 30-year T-bond. RSI tells us that the bond is overbought. The full stochastics at the bottom of the chart confirms that the bond is overbought. And the blue histograms are slanting downwards towards zero. All in all, I don't like the looks of the bonds. Any hint of rising interest rates could send the bond market off the edge of the popularity cliff. 


Gold -- I took today's stock market sell-off as an indication that business will be rotten in the months ahead. Rotten business will put pressure on the Fed to print, print, print. Wide open quantitative easing will put pressure on the dollar, and this, in turn, will put UPWARD pressure on gold. And gold may have started to discount that situation today.


Share |
_______________________________________
Check it out on The MasterCharts

Monday, August 23, 2010

Speculators Hike Net-Long Positions In GoldKitco News

Speculators Hike Net-Long Positions In Gold

23 August 2010, 11:27 a.m.
By Debbie Carlson
Of Kitco News
http://www.kitco.com/
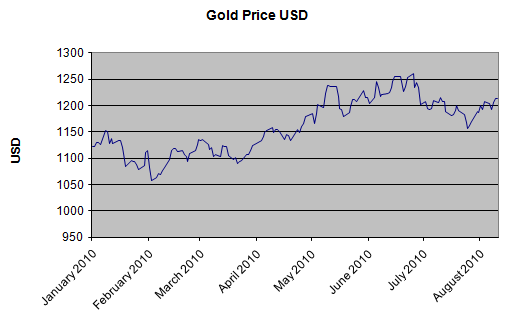
Chicago -- (Kitco News) -- Investor interest in gold jumped as prices held and advanced over $1,200 an ounce as safe-haven buying resumed.
According to data from the U.S. Commodity Futures Trading Commission, the weekly commitment of traders showed speculators added to long gold futures positions in the week ending Aug. 17.
Looking at the disaggregated futures and options combined data, the managed-money accounts added 16,233 longs are now net-long 182,276 contracts, the largest net-long for them since the week of July 13, when their net-long positions totaled 187,077. The peak for the year 2010 to date was 230,422 on May 18.
Similarly, in the legacy futures and options report, funds added 19, 557 contracts to make them net-long 226,964.
Commercials and swap dealers in the disaggregated reports added to their net-shorts, with the producer category increasing shorts by 10,271 contracts to make them net-short 172,129. Swap dealers hiked their short contracts by 11,878 to be net-short 100,750 contracts. Commercials in the legacy futures and options report raised 25,854 short contracts and are now net-short 272,879.
During the timeframe the report covers, Aug. 10 to Aug. 17, gold prices on the Comex division of the New York Mercantile Exchange rallied $30 an ounce for the December contract. A trigger for the rally was holding over $1,200 an ounce. Prices started at $1,198, which was the settlement on Aug. 10 and settled at $1,228.30 on Aug. 17, and prices continued to rise that week.
“This shows that financial investors have been a major force in this recent rally of gold prices. In the reporting week up to last Tuesday, prices advanced by 4%,” said Commerzbank in a research report on Monday.
Barclays Capital said in a research report Monday, using the legacy futures-only data, that the rise in fund longs was the largest one week rise on a net basis since late April.
The rally came on disappointing economic news, which spurred safe-haven buying of gold, as market participants worry about a double-dip recession. Traders also note, though, that volumes during the reporting period were light because of summer holidays.
In addition to investment buying, Commerzbank said physical interest could support prices, noting Tuesday starts the festival season in India, when gold is traditionally given as gifts. They also cited central bank buying, with Russia increasing its gold reserves by more than 15 tons in July to just under 725 tons, according to its central bank. “Although the rise in holdings is likely to have come from the country’s own production, this absent supply will contribute to a tighter gold market,” Commerzbank said.

In other precious metals data, there was little significant change in speculative holdings for silver, platinum and palladium.
Managed-money accounts in silver added 29 long contracts, but cut 144 short contracts and are now net-long 28,429 contracts. Swap dealers are net-short 1,916 contracts, having added 692 shorts and cut 117 longs. Producers are net-short 52,773 contracts.
In platinum, speculators trimmed slightly their net-longs by 299 contracts and added 97 shorts and are now net-long 16,103 contracts. Swap dealers cut shorts by 649 contracts and added 151 longs, making them net-short 6,599 contracts. Producers are net-short 12,804 contracts.
The managed-money accounts added modestly to net-longs in palladium, increasing longs by 326 contracts to be net-long 10,230 contracts. Producers remain net-short 9,802 contracts in palladium and swap dealers are net-short 4,400 contracts.
The data for copper shows managed-money accounts added to long positions, but increased their short positions by a greater amount. These accounts added 1,025 long contracts and 2,603 short positions, remaining net-long 19,180 contracts. Swap dealers and commercials remain net-short, at 44,550 and 56,432 contracts, respectively.
During the time period, most-active September copper rose 2.6 cents a pound, so the swift price drop copper suffered toward the end of last week over global economic health was not included. From Tuesday’s settlement to Friday’s settlement, September copper prices fell 4.75 cents to $3.2910.
Commerzbank said because of this: “net long positions have probably continued to fall since then. The still relatively high positions also hide a risk of new price corrections should market sentiment deteriorate further.”
By Debbie Carlson, of Kitco News;dcarlson@kitco.com; Allen Sykora contributed to this story.

Kitco News
_______________________________________
Check it out on The MasterCharts

Saturday, August 21, 2010

Gold: The Enemy of Currencies

Gold: The Enemy of Currencies
Last week saw gold prices rise despite deflationary fears.
Taking a look at the chart below we can see the gold price in US dollars has traded in a narrow range since May. This is despite the dollar declining for much of that time, see chart further below. (Click to enlarge)
 

 We noted last week that we were going to keep an eye on the Fed Open Market Committee meeting in case they decided to increase the money supply even further. But they didn’t.

The Federal Open Market Committee failed to commit to anything... they didn’t say they would resort to more quantitative easing... they didn’t say they wouldn’t. Instead they’re pausing for breath.

The inflation, deflation debate continues 
As the deflationary, inflationary debate continues to be waged between financial heavyweights we stand on the side and watch. We’ve always believed the act of quantitative easing is inflationary; It inflates the money supply. We also think the governments only way out, of this huge debt burden it has imposed upon itself, is to inflate the debt. If you make the value of your debt less you have less to pay back, but it’s a juggling act. Inflate too much and you run the risk of hyperinflation, something that, the Germans will tell you, doesn’t bode well for an economy.

US Trade Deficit
What’s the next move for gold? We have to wait and see what happens around the globe to find that out. Certainly, its course is no longer dictated by the movement of the dollar as much as it once was. Will this relationship resurface? Probably, but when it does it will most likely be when the dollar makes a significant move, triggering panic in the dollar or gold.

Which is more likely – a panic or strength in the dollar?
Last week Bloomberg reported that the US trade deficit has swelled to an incredible figure:
“The U.S. trade deficit widened by $7.9 billion in June, the most since record-keeping began in 1992, to $49.9 billion, a report from the Commerce Department showed. Exports posted the biggest decline since April 2009.

“Investors should prepare for “major structural changes” as the global economy shifts to slower growth, Mohamed A. El- Erian, chief executive officer at Pacific Investment Management Co. said yesterday in a radio interview on “Bloomberg Surveillance” with Tom Keene.”

This news reverberated around the markets.

A quick look at the VIX index shows us that fear has reentered the market... again. At the far right of the graph you can see the index rises sharply which signifies a growing fear of volatility in the markets.


With a stuttering economy and growing tension between the US and China, the trade balance could play a huge role in a dollar devaluation. But in order for the dollar to drop further people will have to lose faith in its safe haven status. Which means an alternative currency will need to take its place. The problem with this scenario is that there aren’t too many other candidates for the role as a global reserve currency. And whilst that is the case gold can continue to take center stage.

Will things get better?
In the grand scheme of things the debt, from Dubai to Greece has just been shuffled around. The run up in the stock markets suggests stability but investors are cautious. They’re wondering if this is another ‘suckers rally’. And they’re right to be cautious. If you play with fire... well you know that old saying. In other words it doesn’t end well.
Can things get better? That depends on what governments do.

More money printing can only add to the attractiveness of gold. But gold is the enemy of currencies. As Alan Greenspan once noted, to control the dollar you have to control the gold price.

The fight for governments around the world is one which is traded in blows against the gold price. And should they win the price of gold may very well settle back to lower prices until supported by a strong level of jewelry demand. But this is dependent on currencies being kept under control. Both the US and the UK have not ruled out further money printing, and with each new wave of money the original currency is worth less and less.

It all sounds too reactionary to us. There doesn’t seem to be a grand plan. Maybe there cannot be as the markets lead themselves. But whatever the case, none of the actions by those in power have any finiteness about them. There’s no plan and no control.

Disclosure: No positions
http://seekingalpha.com/article/221174-gold-the-enemy-of-currencies?source=feed
Share |
_______________________________________
Check it out on The MasterCharts

Friday, August 20, 2010

A Brief History of the Dollar

A Brief History of the Dollar

Calafia Beach Pundit submits:


Here, in a nutshell, is my version of the history of the dollar's history, with a focus on its major turning points. As a point of reference, I'm using the Fed's Real Broad Dollar Index (chart above), which measures the dollar's value against a large basket of trade-weighted currencies, all adjusted for changes in relative inflation. It's arguably the best measure of the dollar's true value against other currencies. I've marked 6 key turning points in the dollar, and I explain here the key events occurring around the time of each turning point. I also opine on the future of the dollar.

A: Most measures of the dollar's value only go back to 1973. That's unfortunate, since the modern history of the dollar begins in August 1971, when Nixon ended the dollar's convertibility into gold. Prior to that point, the dollar had been fixed to gold at $35/oz. since 1934, and most of the world's currencies were pegged in some fashion to the dollar. Nixon's decision to abandon the gold standard was the catalyst for what would eventually prove to be a major devaluation of the dollar. The underlying cause of the dollar's collapse, however, was the Fed's decision to ease monetary policy in support of Great Society spending programs. The Fed's easy money policy started in the mid-1960s, and it was reflected in a steadily increasing outflow of gold. The Fed was holding interest rates at artificially low levels, and this was undermining the world's confidence in the dollar. Central banks began demanding gold in exchange for their dollar holdings, until Nixon's decision put an end to that. That decision effectively relieved the Fed of the need to raise interest rates significantly, which in turn exposed the fact that there was a huge excess supply of dollars in the world.

Complete Story

A Brief History of the Dollar

https://blogger.googleusercontent.com/img/b/R29vZ2xl/AVvXsEjYxDjFUf_c6oeNNdKQnrdRle3D82T8VYtKBHFbcb_Yv6DCCh2MwtMQ1jvqRiaDMzwYLrFSFdbto-_pwdfW7WZNH2JrYy7gWSVk6p6hkCy9EBmBgCTAMKUgSIFDBRfnZF8y5MsWtw3NNsU/s1600/Real+Broad+Dollar+Index

-- The MasterFeeds

If This Were A Stock....

If This Were A Stock....


By Guy M. Lerner
TheTechnicalTake
http://thetechnicaltakedotcom.blogspot.com/
See figure 1 a weekly price chart. The 40 week moving average (i.e, red line) is
heading higher, and prices are trading above key pivot points, which are areas of
support (buying) and resistance (selling). In essence, this is a "beautiful" chart with
lots of momentum (i.e., note the breakout gaps). If this were a stock, the analysts
and pundits would be all over the "breakout" ---blah, blah, blah.
Figure 1. Price Chart/ weekly
But figure 1 isn't a stock, it is the yield on the 30 year Treasury, and the chart has
been turned upside down. What I hear and read is this move in Treasury bonds isn't
sustainable. A sub 3% yield isn't possible, but isn't that what "they" said about a sub 4%
yield? Which happens to be in the rear view mirror.
People still don't believe, and they are not interpreting the significance of the price
action correctly. Maybe if this were a stock people would be wowed by the price
action. But they aren't. For the record, figure 2 is a weekly chart of the yield on the
30 year Treasury bond (symbol: $TYX.X). Are the low yields of late 2008 the next
stop?

If This Were A Stock....

_______________________________________
Check it out on The MasterCharts

Thursday, August 19, 2010

Bankruptcies: Going for broke | The Economist


Bankruptcies: Going for broke | The Economist: "Bankruptcies rise in America
Aug 18th 2010

BANKRUPTCY filings rose 20% in the year to June 30th compared with the previous 12-month period, according to statistics released on August 17th by the Administrative Office of the US Courts. This takes quarterly filings to their highest point since tougher bankruptcy laws were introduced at the end of 2005. That change brought a spike of bankruptcies, as companies and individuals rushed to declare themselves broke under the more lenient old regime. The data suggest that an older trend is reasserting itself. This is could be more bad news for America—or it could just mean that creative destruction is alive and well."

________________________

Tuesday, August 17, 2010

China's economy overtakes Japan's in real terms

Hello America

China's economy overtakes Japan's in real terms

CHINA has become the world's second biggest economy according to data released on Monday August 16th. Japan's economy fell behind China's at market exchange rates in the second quarter (it has been number three in PPP terms for some time). These numbers are not strictly comparable: Japan's data have been seasonally adjusted while those for China have not. Quibbles aside, Japan will surely be eclipsed soon, if it has not been already. Data compiled by Angus Maddison, an economist who died earlier this year, suggest that China and India were the biggest economies in the world for almost all of the past 2000 years. Why they fell so far behind may be more of a mystery than why they are currently flourishing.


Comparte|

Hedge Funds Cut Bets on Rising Gas by 23% as Prices Fall: Energy Markets - Bloomberg


Hedge Funds Cut Bets on Rising Gas by 23% as Prices Fall: Energy Markets

Hedge funds slashed their bets on rising natural gas to the lowest level this year as prices fell, a sign the fuel may repeat last year’s 19 percent August slide during a so-far quiet hurricane season in the Gulf of Mexico.
Hedge funds and other large speculators cut their bullish bets by 23 percent in the week ended Aug. 10, the Commodity Futures Trading Commission reported. Natural Gas has declined 14 percent this month, dropping to $4.228 per million British thermal units today on the New York Mercantile Exchange.
Investors retreated from gas markets this year as prices declined 22 percent amid forecasts that stockpiles will be near record highs by the end of October. Demand for the fuel will be slow to recover as consumer confidence hovers near an eight- month low.
“Last year, we saw prices go significantly below $4,” said Andy Lipow, president of consulting firm Lipow Oil Associates LLC in Houston. “There’s a significant amount of supply out there and the overall economy is really having trouble recovering and growing. The increases in demand for natural gas are going to be slower than people expect.”
Net-long positions in futures and options combined in four natural-gas contracts decreased by 28,719 futures equivalents, or 23 percent, to 94,058 in the week ended Aug. 10, the CFTC data showed.
Whether hedge funds and other large speculators will profit from their short bets remains to be seen, Lipow said.
“We’ve seen funds be big winners and big losers in the natural gas markets,” Lipow said.
Gas futures last year dropped to $2.508 per million Btu on Sept. 3, the lowest price in more than seven years.
Vulnerable Positions
The increase in short positions leaves hedge funds vulnerable to sharp moves higher in prices that would probably accompany the threat of a hurricane heading toward the Gulf of Mexico, said Teri Viswanath, director of commodities research at Credit Suisse Securities USA in Houston.
“We’re right around the corner from the heaviest portion of the hurricane season,” Viswanath said. “Given that possibility, is the market getting ripe for a short squeeze? I think it is.”
The U.S. on Aug. 5 reduced its forecast for the 2010 Atlantic hurricane season to 14 to 20 named storms, down from 14 to 23, because of less activity than expected in the first two months of the season.
Eight to 12 of those storms are expected to become hurricanes, according to Gerry Bell, the lead seasonal hurricane forecaster for the U.S. Climate Prediction Center in Camp Springs, Maryland.
Reduced Gulf Output
The sluggish economy, combined with rising production and inventories, will continue to weigh on gas, Lipow said. The bullish impact of any hurricane will be muted since the Gulf of Mexico accounts for 10 percent of U.S. gas production, down from 17 percent in 2005.
Consumer spending, which makes up 70 percent of the world’s largest economy, may not pick up in the absence of a recovery in the labor market, according to the Federal Reserve. Fed policy makers last week made their first attempt to shore up a recovery they said was likely to be “more modest” than earlier anticipated.
Natural gas inventories rose 37 billion cubic feet to 2.985 trillion in the week ended Aug. 6, the Energy Department reported Aug. 12. U.S. gas stockpiles at the end of October may reach 3.752 trillion cubic feet, the department said in an outlook on Aug. 10. Supplies touched a record 3.84 trillion cubic feet in November 2009.
Price Pressure
“Pressure is likely to continue on the natural gas prices,” Lipow said. “Supply disruptions are minimal and we’re seeing the forecast for storms decline.”
The Atlantic hurricane season so far has had less of an impact than expected on gas production, the department said in the outlook last week. Hurricane Alex and Tropical Storm Bonnie this year reduced production by 8 billion cubic feet, less than the 20 billion the government had expected, the report showed.
The funds’ “view of the market is bearish,” said Tim Evans, an energy analyst at City Futures Perspective in New York. “It’s a flow of selling that has weighed on prices, and we’ve got to get through that before prices can rise.”
The measure of net longs includes an index of four contracts adjusted to futures equivalents: Nymex natural gas futures, Nymex Henry Hub Swaps, Nymex Henry Hub Penultimate Swaps, and ICE Henry Hub Swaps. Henry Hub in Erath, Louisiana, is the delivery point for the Nymex futures, a benchmark price for the fuel.
To contact the reporter on this story: Asjylyn Loder in New York at aloder@bloomberg.net

Thursday, August 12, 2010

U.S.-China Trade Gap Stirs Lawmakers - WSJ.com


U.S. Lawmakers Gear Up to Seek New Yuan Policy

WASHINGTON—The U.S. trade deficit with China in June hit its highest level in nearly two years and could spur congressional pressure on Beijing to revamp its currency policy.

America's trade deficit with China jumped 17% in June over the previous month to $26.2 billion, the biggest gap since October 2008. Earlier this week, China said its overall trade surplus hit $28.7 billion in July, an 18-month high.
Associated Press
A production line in Guangdong province, in southern China, in May.

The Commerce Department figures could set the stage for a fight in Congress this fall over China's currency policy. Some lawmakers, arguing that China has set the yuan artificially low to make its exports more price competitive on global markets, are keen to pass laws that would penalize countries that are found to be manipulating their currencies.

China, under pressure from the U.S. and other countries, announced a shift to a more-flexible exchange rate in June. But the yuan has appreciated less than 1% since then, and some economists say that it remains undervalued against the dollar by at least 25%.

While efforts to pass such legislation have made little headway, lawmakers and industry groups agree that the issue could gain traction in September, given that voters, who head to the polls in November, are angry about the country's continued weak economy and high unemployment rate.

A number of bills have garnered bipartisan support, including measures promoted by Tim Ryan (D., Ohio) and Patrick Murphy (D., Pa.) in the House, and by Charles Schumer (D., N.Y.) in the Senate.

These efforts would, among other things, make it easier for companies to seek import duties on goods from countries designated as having undervalued currencies. The Ryan-Murphy bill has more than 127 co-sponsors, including 37 Republicans.

Nadeam Elshami, a spokesman for House Speaker Nancy Pelosi (D., Calif.), said the House Ways and Means Committee would hold a hearing on the currency issue in September after Congress returns from summer recess.

"But no final decisions have been made on moving legislation forward," he said.

Sen. Sherrod Brown (D., Ohio), a co-sponsor of the Schumer bill and a member of President Barack Obama's Export Council, wrote Mr. Obama on Aug. 4, urging the administration to take tougher measures to address "unfairly subsidized exports" by countries such as China. Ten other senators signed the letter, including Republicans Jim Bunning of Kentucky and Olympia Snowe of Maine.

The Treasury Department on Wednesday declined to comment on the U.S.-China trade gap or China's currency policy.

Business groups are expected to intensify their lobbying on the issue, although they differ over whether punitive legislation aimed at China's currency policy is the best solution for narrowing the U.S.-China trade gap.

Augustine Tantillo, executive director of the American Manufacturing Trade Action Coalition, a Washington trade group representing U.S. manufacturers, says the group backs the Ryan-Murphy bill and is lobbying lawmakers, targeting those from Midwestern and Southeastern states with large manufacturing sectors and high unemployment.

"These trade surpluses aren't a result of happenstance," he said. "We're hoping concerns about job creation and the fall election environment will finally give us an opportunity to bring the legislation to a vote."

Erin Ennis, vice president for the U.S.-China Business Council, which represents U.S. companies doing business in China, said the window for China to "show it was serious" about addressing U.S. concerns about the yuan would close in September, when Congress returns to session.

But while Ms. Ennis expected the Chinese currency policy to be a major issue in the fall, "this isn't our member companies' top priority," she said.

Rather, she said that Congress and the administration should focus on reducing barriers to China's market and on the country's new "indigenous innovation" policy, which many Western companies say unfairly favors Chinese companies by promoting domestic innovation.
Write to Kathy Chen at kathy.chen@wsj.com
U.S.-China Trade Gap Stirs Lawmakers - WSJ.com
_______________________________________
Check it out on The MasterCharts

ShareThis

World Climate Widget

MasterSearch


MasterCharts