MasterSearch

Tuesday, June 06, 2017

#Gold Stocks: Focus on Leadership


Focus on Leadership Within the Gold Industry from Paradigm Capital 

Highlighting leadership names within the gold industry. Common characteristics include price above the 200-day moving average, relative uptrend versus the TSX Global Gold Index, and 50-day moving average > 200-day moving average. With Gold coming into converging resistance along the 2017 highs and 2011 downtrend, we continue to recommend sticking with leadership names.


Intermediate Producers:

-          Agnico-Eagle Mines Ltd.

-          Centerra Gold Corp.

-          IAMGold Corp.

-          Kirkland Lake Gold Ltd.

-          OceanaGold Corp.


Junior Producers:

-          Alio Gold Inc.

-          Wesdome Gold Mines Ltd.


Royalty Co's:

-          Franco-Nevada Corp.

-          Aurico Metals Inc.


Developers:

-          Sabina Gold & Silver Corp.

-          Victoria Gold Corp.


Agnico-Eagle Mines Ltd.:


Centerra Gold Inc.:


IAMGold Corp.:


Kirkland Lake Gold Ltd.:


OceanaGold Corp.:


Alio Gold Inc.:


Wesdome Gold Mines Ltd.:


Franco-Nevada Corp.:


AuRico Metals Inc.:


Sabina Gold & Silver Corp.:


Victoria Gold Corp.:


Sunday, April 16, 2017

U. S. stock markets looking awfully tippy $SPX $RUT $DJIA $INDU

It is high noon to nail down your profits.


Long weekends have the big advantage that people have more time for their families and more time to think about their live and other things like to figure out to make money.


We took the occasion to look at daily charts of three U.S. stock indices, the Dow Jones, Standard & Poor 500, and the Russell 200 Index.


The Dow Jones Industrial Index and the S&P 500 Index fell last Thursday below the 50-day moving average. The Russell 2000 Small Capitalization Index has already for weeks a tough time to hold the 50-day moving average (attachments 1-4).


We still think the U.S stock markets are in a overture stage, talking in Opera terms, of something bigger to come. This is also valuable for European stock markets. On U.S. inauguration day, on January 20, 2017, the lights turned from green to yellow (amber). We all know from traffic lights, the next colour is red.


Wednesday, February 22, 2017

#USD Dollar Index - Waiting for the upside breakout


Attachment 1 is the U. S. Dollar Index long term Point&Figure chart. For the last 2 years the index has been forming a Broadening or Megaphone pattern. A breakout of 102 would signal that the index would be departing for a new uptrend.


The U.S. Dollar Index, which reflects a basket of currencies versus the U. S. Dollar, has shown some strength lately. Attachment 2 indicates the components of the U.S. Dollar Index. This is the index the Federal Reserve is watching.


The reason is once again the financial condition of Greece. As in the past a lot of talking is taking place among Brussel's politicians (EU), the International Monetary Fund (IMF) and the Government of Greece.


Most likely, nobody in the European Union has an interest to deal with the real financial crisis (haircut on government bonds, let Greece out of the EU in order to devalue the new currency) as the elections in France are just two months away. Some new funds will flow to Greece to calm down the game. In other words the problem will be postponed to an indefinite date.


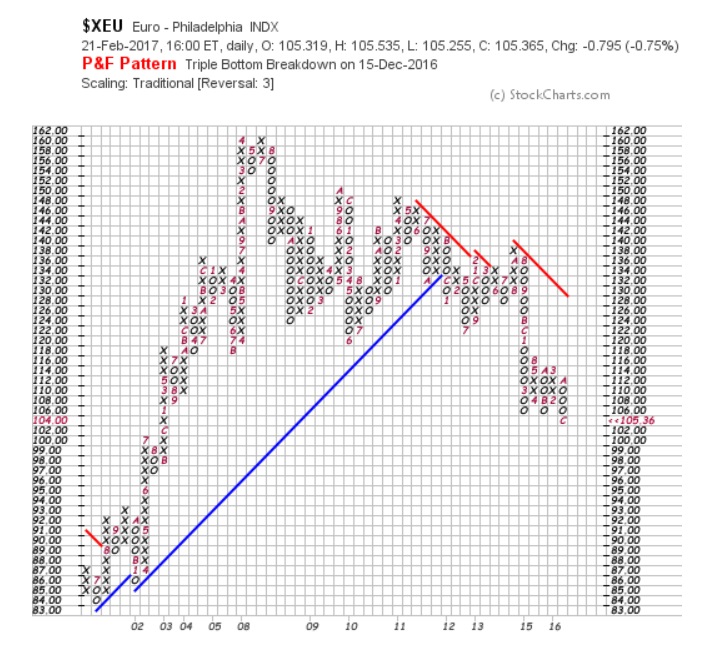
Attachment 3 shows the EURO versus U. S. Dollar

long term Point&Figure chart. It indicates the dramatic decline of the EURO in spring 2014 from 136 to 105 in spring 2015. We are bullish on the U. S. Dollar and wouldn't be surprised to see the next downtrend to be started in the next few months.


ShareThis

Gold or Silver?

MasterSearch